
User Manual

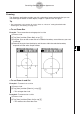

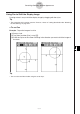
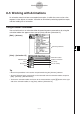
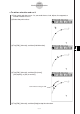


Table Of Contents
- Getting Ready
- Contents
- About This User’s Guide
- Chapter 1 Getting Acquainted
- Chapter 2 Using the Main Application
- 2-1 Main Application Overview
- 2-2 Basic Calculations
- 2-3 Using the Calculation History
- 2-4 Function Calculations
- 2-5 List Calculations
- 2-6 Matrix and Vector Calculations
- 2-7 Using the Action Menu
- 2-8 Using the Interactive Menu
- 2-9 Using the Main Application in Combination with Other Applications
- 2-10 Using Verify
- Chapter 3 Using the Graph & Table Application
- Chapter 4 Using the Conics Application
- Chapter 5 Using the 3D Graph Application
- Chapter 6 Using the Sequence Application
- Chapter 7 Using the Statistics Application
- 7-1 Statistics Application Overview
- 7-2 Using List Editor
- 7-3 Before Trying to Draw a Statistical Graph
- 7-4 Graphing Single-Variable Statistical Data
- 7-5 Graphing Paired-Variable Statistical Data
- 7-6 Using the Statistical Graph Window Toolbar
- 7-7 Performing Statistical Calculations
- 7-8 Test, Confidence Interval, and Distribution Calculations
- 7-9 Tests
- 7-10 Confidence Intervals
- 7-11 Distribution
- 7-12 Statistical System Variables
- Chapter 8 Using the Geometry Application
- Chapter 9 Using the Numeric Solver Application
- Chapter 10 Using the eActivity Application
- Chapter 11 Using the Presentation Application
- Chapter 12 Using the Program Application
- Chapter 13 Using the Spreadsheet Application
- Chapter 14 Using the Setup Menu
- Chapter 15 Configuring System Settings
- 15-1 System Setting Overview
- 15-2 Managing Memory Usage
- 15-3 Using the Reset Dialog Box
- 15-4 Initializing Your ClassPad
- 15-5 Adjusting Display Contrast
- 15-6 Configuring Power Properties
- 15-7 Specifying the Display Language
- 15-8 Specifying the Font Set
- 15-9 Specifying the Alphabetic Keyboard Arrangement
- 15-10 Optimizing “Flash ROM”
- 15-11 Specifying the Ending Screen Image
- 15-12 Adjusting Touch Panel Alignment
- 15-13 Viewing Version Information
- Chapter 16 Performing Data Communication
- Appendix
20050501
u To edit an animation
(1) While the animation you want to edit is on the display, tap [Edit], [Animate], and then
[Edit Animations].
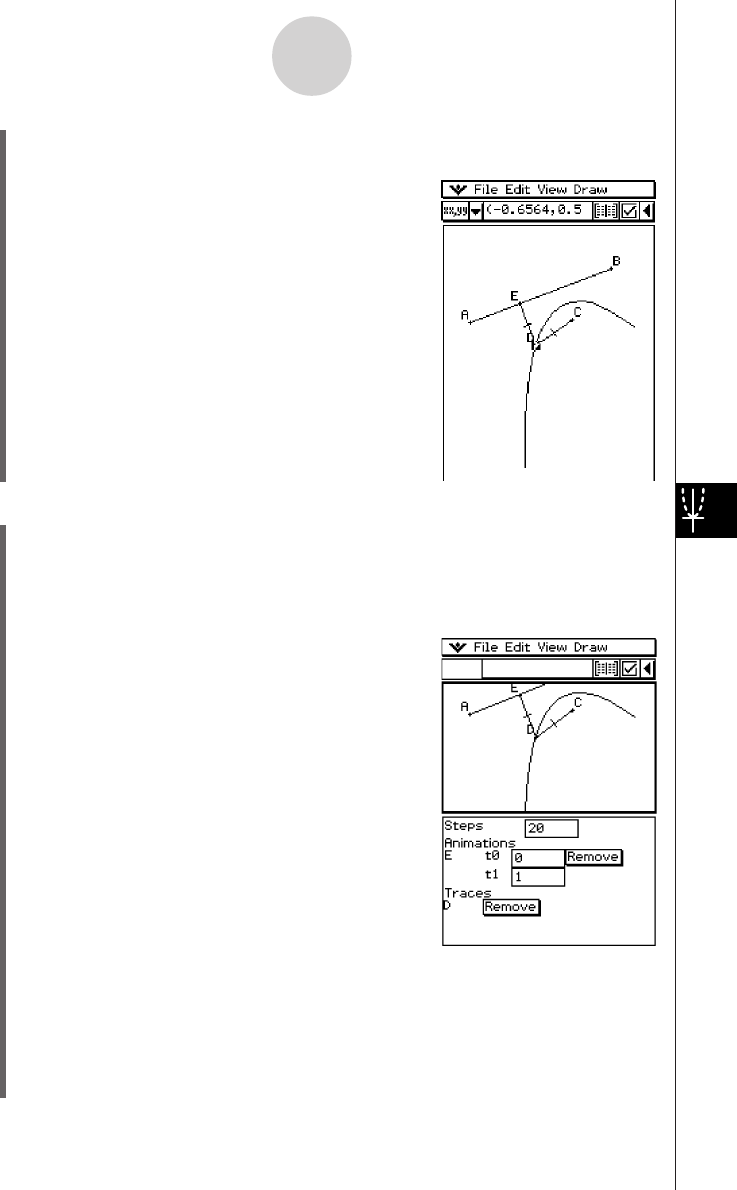
• This displays the animation editing window in the lower window. The upper window
contains the animation that we just completed in “To trace a locus of points”. See
page 8-5-4 for information about specifying the trace point.
(2) Edit the animation following the procedure below.
Steps
This setting specifies how many steps point E takes to
move along line segment AB. The initial default value
is 20.
Animations
• The “E” under “Animations” indicates that point E is
the point moved by the animation. When you are
building multiple animations, a list of all applicable
points appears here.
•Tapping [Remove] deletes the applicable animation.
•“t0” and “t1” specify the range of movement of point
E on line segment AB. The initial default values are
t0 = 0 and t1 = 1.
•During animation, the length of AB is considered to
be one unit. The default values specify that movement of point E is from start point A
(point where length equals 0) up to end point B (point where length equals 1).
•Changing the value of t0 to 0.5, for example, causes point E to move from the middle
of line segment AB to point B.
•Changing the value of t0 to −1, causes point E to begin at a point outside line
segment AB (in this case, at a point a distance equivalent to the length of line
segment AB) and ending with point B.
8-5-6
Working with Animations
(13) Tap [Edit], [Animate], and then [Trace].
(14) With point D still selected, tap [Edit], [Animate], and then [Go (once)].
• This should cause a parabola to be traced on the
display. Note that line segment AB is the directrix
and point C is the focus of the parabola.