
User Manual
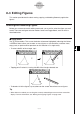
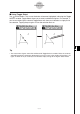
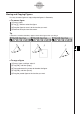

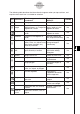


Table Of Contents
- Getting Ready
- Contents
- About This User’s Guide
- Chapter 1 Getting Acquainted
- Chapter 2 Using the Main Application
- 2-1 Main Application Overview
- 2-2 Basic Calculations
- 2-3 Using the Calculation History
- 2-4 Function Calculations
- 2-5 List Calculations
- 2-6 Matrix and Vector Calculations
- 2-7 Using the Action Menu
- 2-8 Using the Interactive Menu
- 2-9 Using the Main Application in Combination with Other Applications
- 2-10 Using Verify
- Chapter 3 Using the Graph & Table Application
- Chapter 4 Using the Conics Application
- Chapter 5 Using the 3D Graph Application
- Chapter 6 Using the Sequence Application
- Chapter 7 Using the Statistics Application
- 7-1 Statistics Application Overview
- 7-2 Using List Editor
- 7-3 Before Trying to Draw a Statistical Graph
- 7-4 Graphing Single-Variable Statistical Data
- 7-5 Graphing Paired-Variable Statistical Data
- 7-6 Using the Statistical Graph Window Toolbar
- 7-7 Performing Statistical Calculations
- 7-8 Test, Confidence Interval, and Distribution Calculations
- 7-9 Tests
- 7-10 Confidence Intervals
- 7-11 Distribution
- 7-12 Statistical System Variables
- Chapter 8 Using the Geometry Application
- Chapter 9 Using the Numeric Solver Application
- Chapter 10 Using the eActivity Application
- Chapter 11 Using the Presentation Application
- Chapter 12 Using the Program Application
- Chapter 13 Using the Spreadsheet Application
- Chapter 14 Using the Setup Menu
- Chapter 15 Configuring System Settings
- 15-1 System Setting Overview
- 15-2 Managing Memory Usage
- 15-3 Using the Reset Dialog Box
- 15-4 Initializing Your ClassPad
- 15-5 Adjusting Display Contrast
- 15-6 Configuring Power Properties
- 15-7 Specifying the Display Language
- 15-8 Specifying the Font Set
- 15-9 Specifying the Alphabetic Keyboard Arrangement
- 15-10 Optimizing “Flash ROM”
- 15-11 Specifying the Ending Screen Image
- 15-12 Adjusting Touch Panel Alignment
- 15-13 Viewing Version Information
- Chapter 16 Performing Data Communication
- Appendix
20050501
Icon Icon Name
This icon appears when this
is selected:
Tapping this icon
displays:
Lockable
Rotation
angle
Ye s
F
Two points created by
[Rotation]
Angle of rotation
Scale of
dilation
Ye s
2
Two points (like Point A and
Point A’) on a figure created by
[Dilation]
Scale of dilation
Transform
matrix
No
}
Two points (like Point A and
Point A’) on a figure created by
[Rotation], [Dilation], or
[General Transform]
Transform matrix
Tip
• The “Direction” and “Rotation angle” items always display information in degrees, regardless of
the currently selected angle unit setting.
8-3-6
Editing Figures
u To display the area of a triangular area
You can use the measurement box to display the area of a triangle formed by any three
points you select on the display.
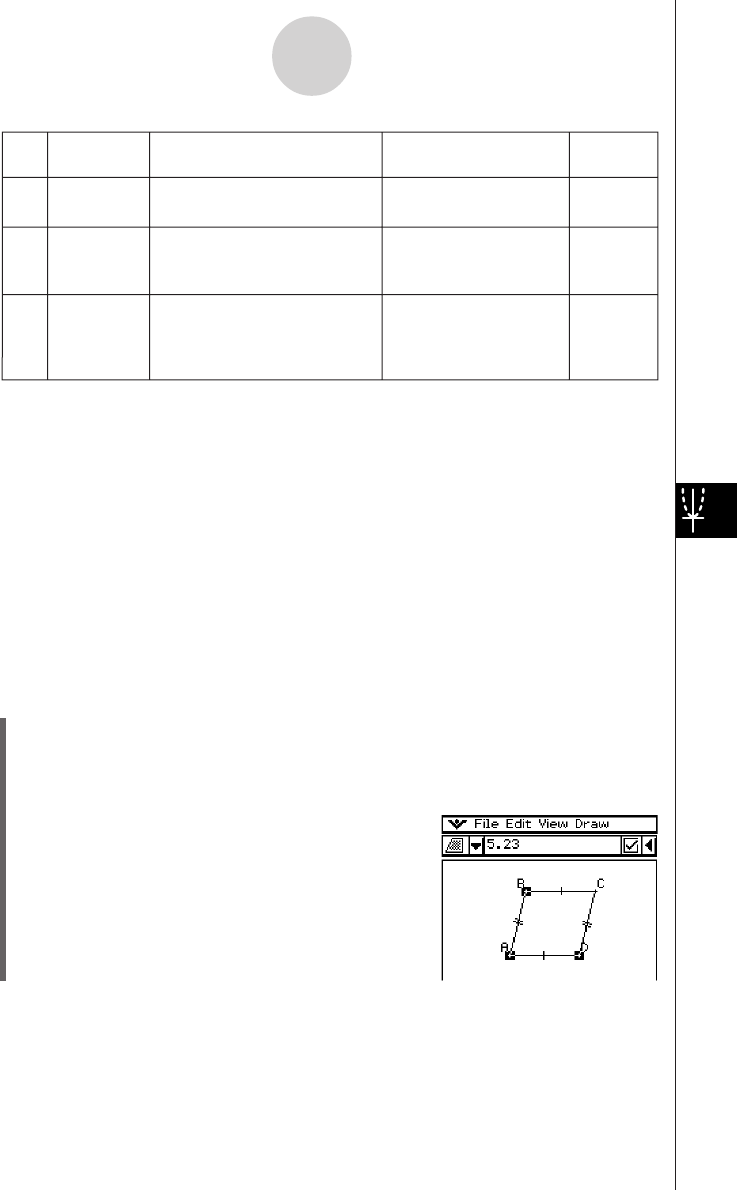
Example: To use the parallelogram ABCD, in which sides AD and BC are parallel, to
determine the areas of the triangles formed by side AD and point B, and side AD
and point C
(1) Draw the parallelogram.
• If you need to, select [Edit] and then [Clear All] before beginning this example.
(2) Tap u on the toolbar to display the measurement box.
(3) Select points A, D, and B.
• This causes the area of the triangle ADB to appear
in the measurement box.
You can use the measurement box to determine certain measurements.
In the first example below, three points are selected on the screen and the measurement box
shows the area of the triangle formed by them.
The second example shows how to view the measurements of a line segment.