
User Manual


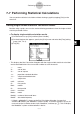
Table Of Contents
- Getting Ready
- Contents
- About This User’s Guide
- Chapter 1 Getting Acquainted
- Chapter 2 Using the Main Application
- 2-1 Main Application Overview
- 2-2 Basic Calculations
- 2-3 Using the Calculation History
- 2-4 Function Calculations
- 2-5 List Calculations
- 2-6 Matrix and Vector Calculations
- 2-7 Using the Action Menu
- 2-8 Using the Interactive Menu
- 2-9 Using the Main Application in Combination with Other Applications
- 2-10 Using Verify
- Chapter 3 Using the Graph & Table Application
- Chapter 4 Using the Conics Application
- Chapter 5 Using the 3D Graph Application
- Chapter 6 Using the Sequence Application
- Chapter 7 Using the Statistics Application
- 7-1 Statistics Application Overview
- 7-2 Using List Editor
- 7-3 Before Trying to Draw a Statistical Graph
- 7-4 Graphing Single-Variable Statistical Data
- 7-5 Graphing Paired-Variable Statistical Data
- 7-6 Using the Statistical Graph Window Toolbar
- 7-7 Performing Statistical Calculations
- 7-8 Test, Confidence Interval, and Distribution Calculations
- 7-9 Tests
- 7-10 Confidence Intervals
- 7-11 Distribution
- 7-12 Statistical System Variables
- Chapter 8 Using the Geometry Application
- Chapter 9 Using the Numeric Solver Application
- Chapter 10 Using the eActivity Application
- Chapter 11 Using the Presentation Application
- Chapter 12 Using the Program Application
- Chapter 13 Using the Spreadsheet Application
- Chapter 14 Using the Setup Menu
- Chapter 15 Configuring System Settings
- 15-1 System Setting Overview
- 15-2 Managing Memory Usage
- 15-3 Using the Reset Dialog Box
- 15-4 Initializing Your ClassPad
- 15-5 Adjusting Display Contrast
- 15-6 Configuring Power Properties
- 15-7 Specifying the Display Language
- 15-8 Specifying the Font Set
- 15-9 Specifying the Alphabetic Keyboard Arrangement
- 15-10 Optimizing “Flash ROM”
- 15-11 Specifying the Ending Screen Image
- 15-12 Adjusting Touch Panel Alignment
- 15-13 Viewing Version Information
- Chapter 16 Performing Data Communication
- Appendix
20050501
7-7 Performing Statistical Calculations
You can perform statistical calculations without drawing a graph by tapping [Calc] on the
menu bar.
Viewing Single-variable Statistical Calculation Results
Besides using a graph, you can also use the following procedure to view the single-variable
statistics parameter values.
u To display single-variable calculation results
(1) On the menu bar, tap [Calc] and then [One-Variable].
(2) On the dialog box that appears, specify the [XList] name and select the [Freq] setting
(page 7-3-3, 7-3-4).
(3) Tap [OK].
7-7-1
Performing Statistical Calculations
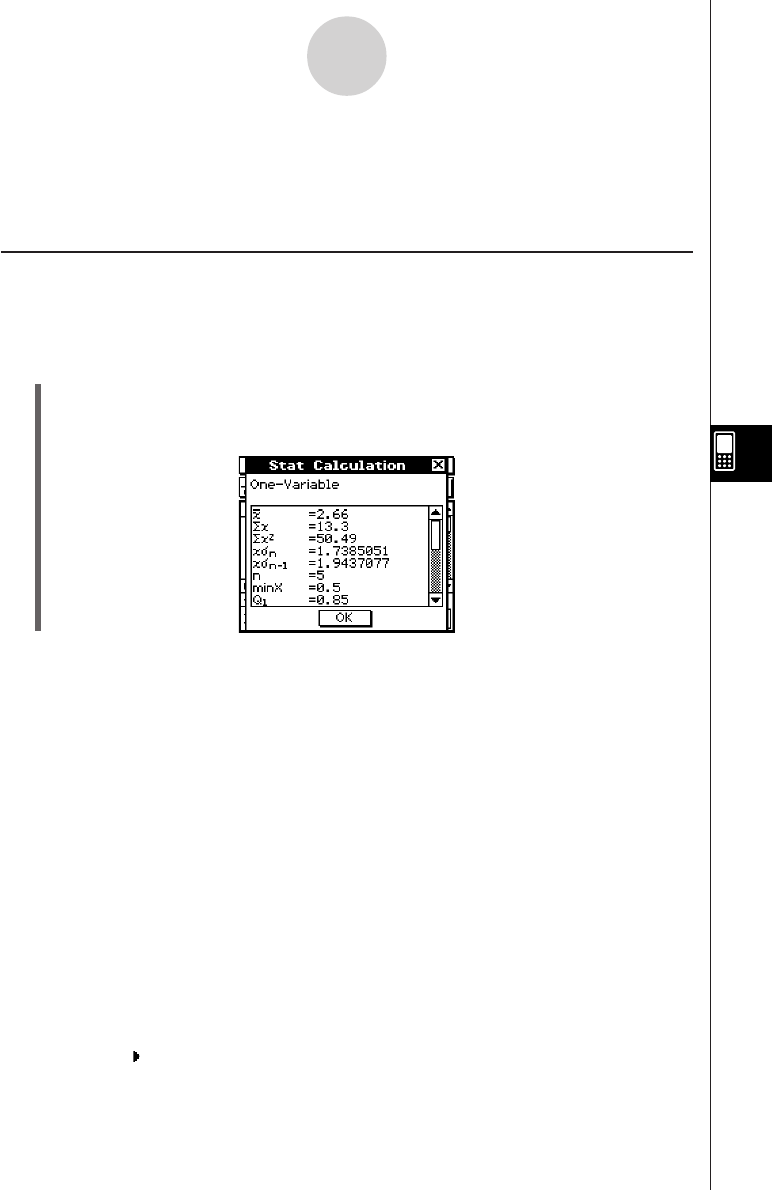
• This displays the Stat Calculation dialog box with the single-variable statistical calculation
results described below. You can use the scrollbar to scroll the results.
o :mean
Σx : sum of data
Σx
2
: sum of squares
xσn : population standard deviation
xσn–1 : sample standard deviation
n : sample size
minX : minimum
Q1 : first quartile
Med : median
Q3 : third quartile
maxX : maximum
Mode : mode*
ModeN : number of data mode items
ModeF : data mode frequency
* If “Mode = ModeStat” is shown on the Stat Calculation dialog box, it means that
solutions are stored in the “ModeStat” system variable. To view the solutions, tap any list
name cell on the List Editor window, input “ModeStat”, and then tap w. This will display
the “ModeStat” system variable contents in the list.