
User Manual
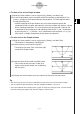

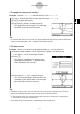


Table Of Contents
- Getting Ready
- Contents
- About This User’s Guide
- Chapter 1 Getting Acquainted
- Chapter 2 Using the Main Application
- 2-1 Main Application Overview
- 2-2 Basic Calculations
- 2-3 Using the Calculation History
- 2-4 Function Calculations
- 2-5 List Calculations
- 2-6 Matrix and Vector Calculations
- 2-7 Using the Action Menu
- 2-8 Using the Interactive Menu
- 2-9 Using the Main Application in Combination with Other Applications
- 2-10 Using Verify
- Chapter 3 Using the Graph & Table Application
- Chapter 4 Using the Conics Application
- Chapter 5 Using the 3D Graph Application
- Chapter 6 Using the Sequence Application
- Chapter 7 Using the Statistics Application
- 7-1 Statistics Application Overview
- 7-2 Using List Editor
- 7-3 Before Trying to Draw a Statistical Graph
- 7-4 Graphing Single-Variable Statistical Data
- 7-5 Graphing Paired-Variable Statistical Data
- 7-6 Using the Statistical Graph Window Toolbar
- 7-7 Performing Statistical Calculations
- 7-8 Test, Confidence Interval, and Distribution Calculations
- 7-9 Tests
- 7-10 Confidence Intervals
- 7-11 Distribution
- 7-12 Statistical System Variables
- Chapter 8 Using the Geometry Application
- Chapter 9 Using the Numeric Solver Application
- Chapter 10 Using the eActivity Application
- Chapter 11 Using the Presentation Application
- Chapter 12 Using the Program Application
- Chapter 13 Using the Spreadsheet Application
- Chapter 14 Using the Setup Menu
- Chapter 15 Configuring System Settings
- 15-1 System Setting Overview
- 15-2 Managing Memory Usage
- 15-3 Using the Reset Dialog Box
- 15-4 Initializing Your ClassPad
- 15-5 Adjusting Display Contrast
- 15-6 Configuring Power Properties
- 15-7 Specifying the Display Language
- 15-8 Specifying the Font Set
- 15-9 Specifying the Alphabetic Keyboard Arrangement
- 15-10 Optimizing “Flash ROM”
- 15-11 Specifying the Ending Screen Image
- 15-12 Adjusting Touch Panel Alignment
- 15-13 Viewing Version Information
- Chapter 16 Performing Data Communication
- Appendix
20050501
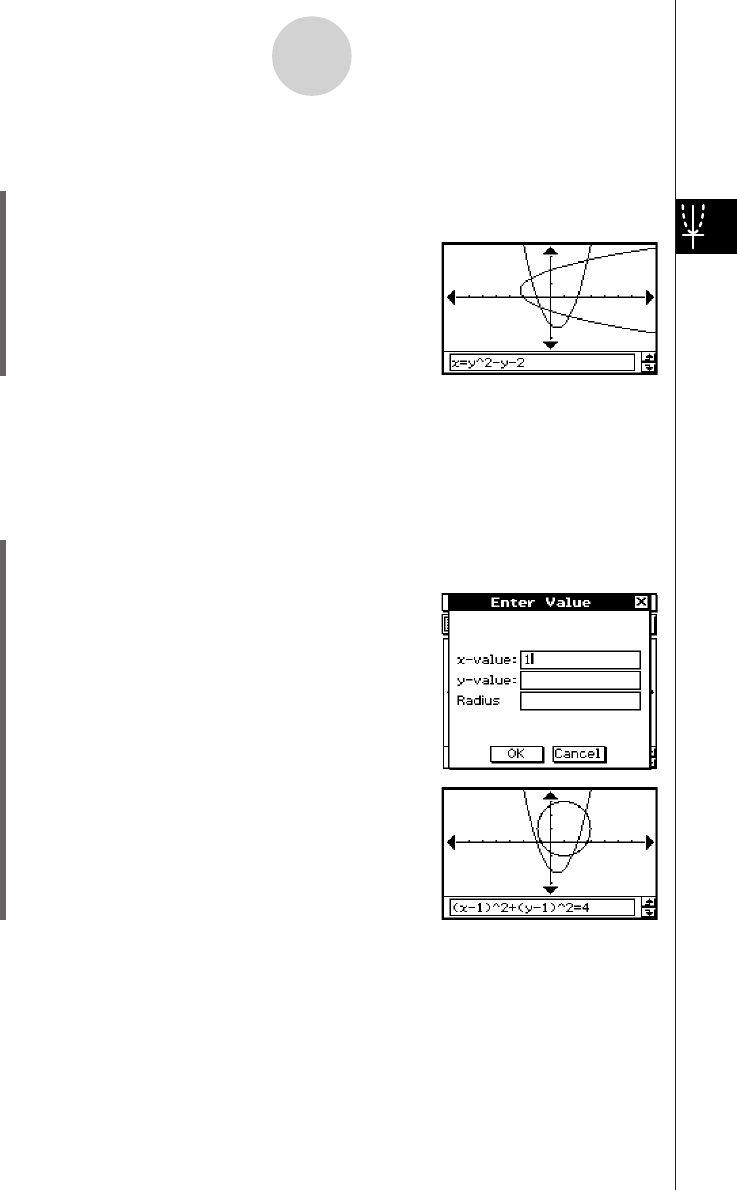
u To graph the inverse of a function
Example: To graph y = x
2
– x – 2 and then overlay it with x = y
2
– y – 2
(1) In line y1 of the Graph Editor window, input and save y = x
2
– x – 2.
(2) Tap $ to graph the function.
(3) Tap [Analysis], [Sketch], and then [Inverse].
• This graphs the inverse function. The message
box briefly shows the inverse function.
3-6-4
Using the Sketch Menu
Tip
• If a function does not have an inverse, the graph produced by the [Inverse] command will be the
result of interchanging the x and y variables of the original function.
u To draw a circle
Example: To draw a circle with a center point located at (1, 1) and a radius of 2
(1) While the Graph window is active, tap [Analysis], [Sketch], and then [Circle].
• This display “Circle” on the Graph window.
(2) Press 1.
• This displays a dialog box for specifying the
center point coordinates (x, y) and the radius r,
with 1 specified as the value of x.
(3) Enter value for x, y, and r, and then tap [OK].
• This closes the dialog box and draws the circle
according to your specifications. The message
box shows the function for the circle.
Tip
• Instead of inputting values, you can also draw a circle using stylus operations only. To do so,
perform the following operation in place of step (2) of the above operation.
(2) Tap the point where you want the center of the circle to be, and then tap a second point
anywhere on the circle's circumference.
•You could also tap the center point, and then drag to the second point.