
User Manual


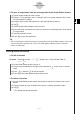
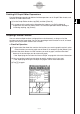


Table Of Contents
- Getting Ready
- Contents
- About This User’s Guide
- Chapter 1 Getting Acquainted
- Chapter 2 Using the Main Application
- 2-1 Main Application Overview
- 2-2 Basic Calculations
- 2-3 Using the Calculation History
- 2-4 Function Calculations
- 2-5 List Calculations
- 2-6 Matrix and Vector Calculations
- 2-7 Using the Action Menu
- 2-8 Using the Interactive Menu
- 2-9 Using the Main Application in Combination with Other Applications
- 2-10 Using Verify
- Chapter 3 Using the Graph & Table Application
- Chapter 4 Using the Conics Application
- Chapter 5 Using the 3D Graph Application
- Chapter 6 Using the Sequence Application
- Chapter 7 Using the Statistics Application
- 7-1 Statistics Application Overview
- 7-2 Using List Editor
- 7-3 Before Trying to Draw a Statistical Graph
- 7-4 Graphing Single-Variable Statistical Data
- 7-5 Graphing Paired-Variable Statistical Data
- 7-6 Using the Statistical Graph Window Toolbar
- 7-7 Performing Statistical Calculations
- 7-8 Test, Confidence Interval, and Distribution Calculations
- 7-9 Tests
- 7-10 Confidence Intervals
- 7-11 Distribution
- 7-12 Statistical System Variables
- Chapter 8 Using the Geometry Application
- Chapter 9 Using the Numeric Solver Application
- Chapter 10 Using the eActivity Application
- Chapter 11 Using the Presentation Application
- Chapter 12 Using the Program Application
- Chapter 13 Using the Spreadsheet Application
- Chapter 14 Using the Setup Menu
- Chapter 15 Configuring System Settings
- 15-1 System Setting Overview
- 15-2 Managing Memory Usage
- 15-3 Using the Reset Dialog Box
- 15-4 Initializing Your ClassPad
- 15-5 Adjusting Display Contrast
- 15-6 Configuring Power Properties
- 15-7 Specifying the Display Language
- 15-8 Specifying the Font Set
- 15-9 Specifying the Alphabetic Keyboard Arrangement
- 15-10 Optimizing “Flash ROM”
- 15-11 Specifying the Ending Screen Image
- 15-12 Adjusting Touch Panel Alignment
- 15-13 Viewing Version Information
- Chapter 16 Performing Data Communication
- Appendix
20050501
u To store an x = equation
Example: To store x = 3y in line x4
(1) On the Graph Editor window, tap [Type] and then [x=Type] to specify an
x = equation.
(2) Tap the box to the right of line number “x4”, and then input the equation:
3y.
(3) Press E to store the equation.
u To store an inequality
Example: To store the inequality y > x
2
– 2x – 6 in line y5
(1) On the Graph Editor window, tap [Type] and then [y>Type] to specify an inequality
expression.
(2) Tap the box to the right of line number “y5”, and then input the expression:
x{2-2x-6.
(3) Press E to store the expression.
Tip
• An error message appears if you enter an expression that does not fit the function type. Either
input the new function into a different line or delete the current function and then change the type
before re-inputting the function.
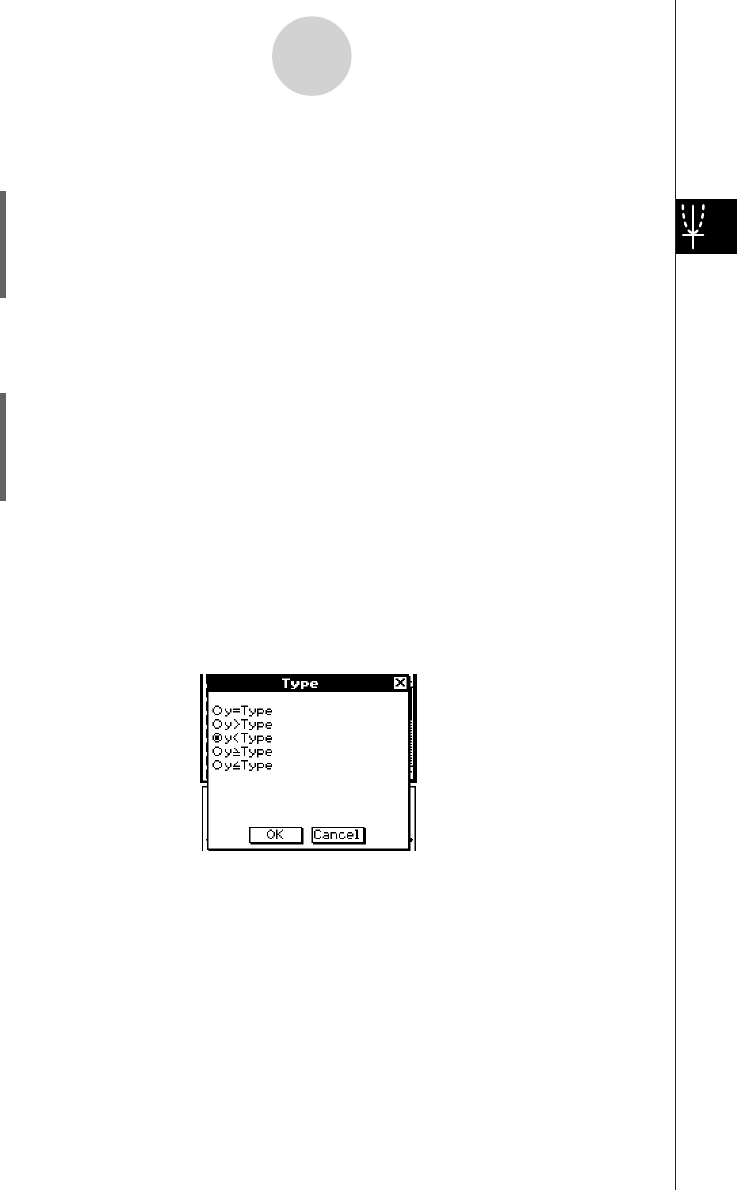
•You can change the equality/inequality sign of an x-type (x =, x>, x<, xt, xs) or y-type
(y =, y>, y<, yt, ys) expression after you input it. Simply tap the current equality/inequality sign.
3-3-4
Storing Functions
On the Type dialog box that appears, select the sign you want and then tap [OK].