
User Manual
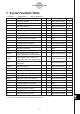
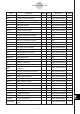
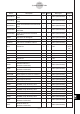
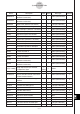
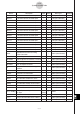
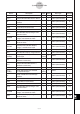
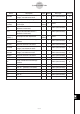
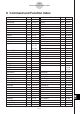
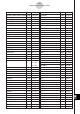
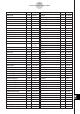
Table Of Contents
- Getting Ready
- Contents
- About This User’s Guide
- Chapter 1 Getting Acquainted
- Chapter 2 Using the Main Application
- 2-1 Main Application Overview
- 2-2 Basic Calculations
- 2-3 Using the Calculation History
- 2-4 Function Calculations
- 2-5 List Calculations
- 2-6 Matrix and Vector Calculations
- 2-7 Using the Action Menu
- 2-8 Using the Interactive Menu
- 2-9 Using the Main Application in Combination with Other Applications
- 2-10 Using Verify
- Chapter 3 Using the Graph & Table Application
- Chapter 4 Using the Conics Application
- Chapter 5 Using the 3D Graph Application
- Chapter 6 Using the Sequence Application
- Chapter 7 Using the Statistics Application
- 7-1 Statistics Application Overview
- 7-2 Using List Editor
- 7-3 Before Trying to Draw a Statistical Graph
- 7-4 Graphing Single-Variable Statistical Data
- 7-5 Graphing Paired-Variable Statistical Data
- 7-6 Using the Statistical Graph Window Toolbar
- 7-7 Performing Statistical Calculations
- 7-8 Test, Confidence Interval, and Distribution Calculations
- 7-9 Tests
- 7-10 Confidence Intervals
- 7-11 Distribution
- 7-12 Statistical System Variables
- Chapter 8 Using the Geometry Application
- Chapter 9 Using the Numeric Solver Application
- Chapter 10 Using the eActivity Application
- Chapter 11 Using the Presentation Application
- Chapter 12 Using the Program Application
- Chapter 13 Using the Spreadsheet Application
- Chapter 14 Using the Setup Menu
- Chapter 15 Configuring System Settings
- 15-1 System Setting Overview
- 15-2 Managing Memory Usage
- 15-3 Using the Reset Dialog Box
- 15-4 Initializing Your ClassPad
- 15-5 Adjusting Display Contrast
- 15-6 Configuring Power Properties
- 15-7 Specifying the Display Language
- 15-8 Specifying the Font Set
- 15-9 Specifying the Alphabetic Keyboard Arrangement
- 15-10 Optimizing “Flash ROM”
- 15-11 Specifying the Ending Screen Image
- 15-12 Adjusting Touch Panel Alignment
- 15-13 Viewing Version Information
- Chapter 16 Performing Data Communication
- Appendix

20050501
Name Description Input Delete Data Type Default
x2InvN Result of InvNorm Calculation – – EXPR (Real Number)
x2σn–1 Sample Standard Deviation of Data 2 – – EXPR (Real Number)
xc
Graph Coordinate Value Storage
––EXPR (Real Number) 0
Variable
xdot View Window 1-dot x-axis Value 䊊 – EXPR (Real Number) 0.1
xfact Factor Zoom X-factor Value 䊊 – EXPR (Real Number) 2
xgrid3D 3D Graph View Window Value 䊊 – EXPR (Real Number) 25
xmax
View Window Display Range x-axis
䊊 – EXPR (Real Number) 7.7
Maximum Value
3D Graph View Window Display
xmax3D
Range x-axis Maximum Value
䊊 – EXPR (Real Number) 3
xmin
View Window Display Range x-axis
䊊 – EXPR (Real Number) –7.7
Minimum Value
xmin3D
3D Graph View Window Display
䊊 – EXPR (Real Number) –3
Range x-axis Minimum Value
xpσn–1 Pooled Sample Standard Deviation – – EXPR (Real Number)
xscl View Window Display Range XScale 䊊 – EXPR (Real Number) 1
xt1(t)~ Graph Expression Input Variable, 䊊
䊊 FUNC
xt100(t) Param Type (Define)
xσn
Population Standard Deviation of x
––EXPR (Real Number)
(Statistics Calculation)
xσn–1
Sample Standard Deviation of x
––EXPR (Real Number)
(Statistics Calculation)
p Mean of y (Statistics Calculation) – – EXPR (Real Number)
y1(x)~ Graph Expression Input Variable, 䊊
䊊 FUNC
y100(x) Y= Expression Type (Define)
yc
Graph Coordinate Value Storage
––EXPR (Real Number) 0
Variable
ydot View Window 1-dot y-axis Value 䊊 – EXPR (Real Number) 0.1
yfact Factor Zoom Y-factor Value 䊊 – EXPR (Real Number) 2
ygrid3D 3D Graph View Window Value 䊊 – EXPR (Real Number) 25
ymax
View Window Display Range y-axis
䊊 – EXPR (Real Number) 3.8
Maximum Value
3D Graph View Window Display
ymax3D
Range y-axis Maximum Value
䊊 – EXPR (Real Number) 3
ymin
View Window Display Range y-axis
䊊 – EXPR (Real Number) –3.8
Minimum Value
α
-7-6
System Variable Table