
User Manual
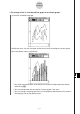
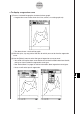
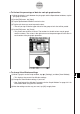
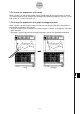
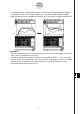
Table Of Contents
- Getting Ready
- Contents
- About This User’s Guide
- Chapter 1 Getting Acquainted
- Chapter 2 Using the Main Application
- 2-1 Main Application Overview
- 2-2 Basic Calculations
- 2-3 Using the Calculation History
- 2-4 Function Calculations
- 2-5 List Calculations
- 2-6 Matrix and Vector Calculations
- 2-7 Using the Action Menu
- 2-8 Using the Interactive Menu
- 2-9 Using the Main Application in Combination with Other Applications
- 2-10 Using Verify
- Chapter 3 Using the Graph & Table Application
- Chapter 4 Using the Conics Application
- Chapter 5 Using the 3D Graph Application
- Chapter 6 Using the Sequence Application
- Chapter 7 Using the Statistics Application
- 7-1 Statistics Application Overview
- 7-2 Using List Editor
- 7-3 Before Trying to Draw a Statistical Graph
- 7-4 Graphing Single-Variable Statistical Data
- 7-5 Graphing Paired-Variable Statistical Data
- 7-6 Using the Statistical Graph Window Toolbar
- 7-7 Performing Statistical Calculations
- 7-8 Test, Confidence Interval, and Distribution Calculations
- 7-9 Tests
- 7-10 Confidence Intervals
- 7-11 Distribution
- 7-12 Statistical System Variables
- Chapter 8 Using the Geometry Application
- Chapter 9 Using the Numeric Solver Application
- Chapter 10 Using the eActivity Application
- Chapter 11 Using the Presentation Application
- Chapter 12 Using the Program Application
- Chapter 13 Using the Spreadsheet Application
- Chapter 14 Using the Setup Menu
- Chapter 15 Configuring System Settings
- 15-1 System Setting Overview
- 15-2 Managing Memory Usage
- 15-3 Using the Reset Dialog Box
- 15-4 Initializing Your ClassPad
- 15-5 Adjusting Display Contrast
- 15-6 Configuring Power Properties
- 15-7 Specifying the Display Language
- 15-8 Specifying the Font Set
- 15-9 Specifying the Alphabetic Keyboard Arrangement
- 15-10 Optimizing “Flash ROM”
- 15-11 Specifying the Ending Screen Image
- 15-12 Adjusting Touch Panel Alignment
- 15-13 Viewing Version Information
- Chapter 16 Performing Data Communication
- Appendix
20050501
13-8-18
Graphing
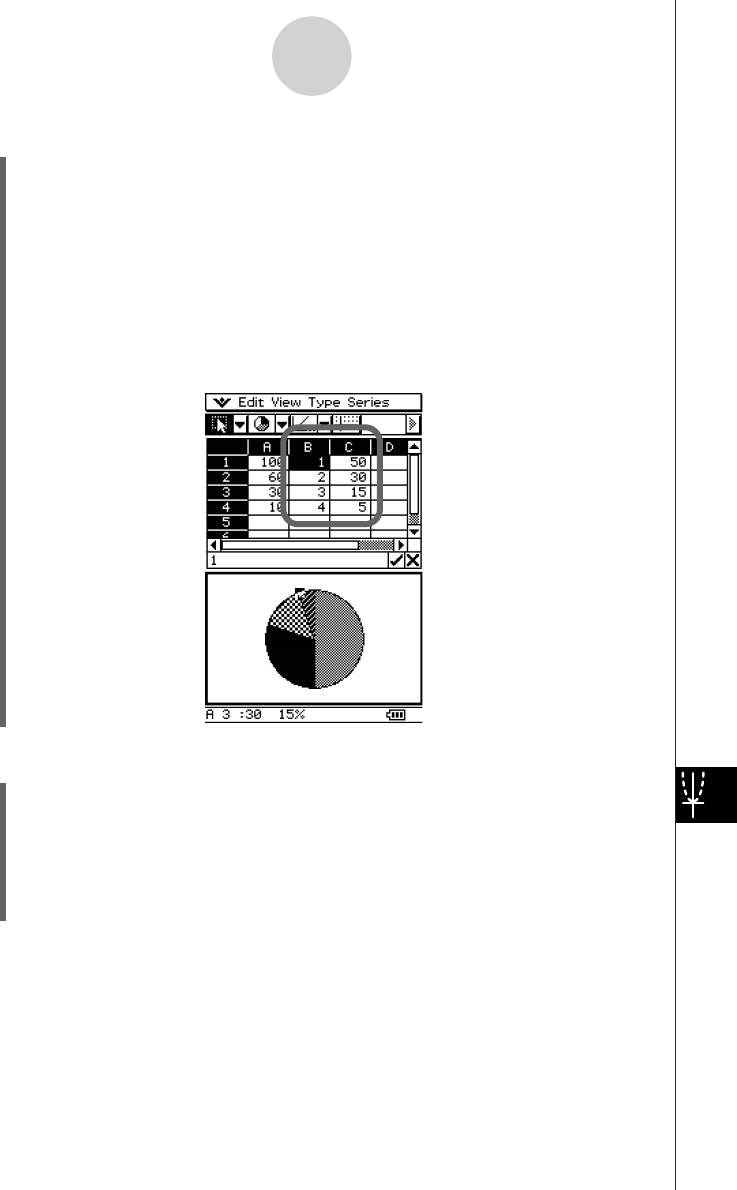
u To find out the percentage of data for each pie graph section
(1) While the display is split between the pie graph and the Spreadsheet windows, tap the
pie graph to select it.
(2) On the [Edit] menu, tap [Copy].
(3) Tap the Spreadsheet window to make it active.
(4) Tap the cell where you want to paste the data.
• The cell you tap will be the upper left cell of the group of cells that will be pasted.
(5) On the [Edit] menu, tap [Paste].
• This pastes two columns of values. The numbers in the left column are pie graph
section numbers. The values in the right column are the percentages that the data in
each section of the pie graph represents.
u To change View Window settings
(1) While a graph is on the Graph window, tap O, [Settings], and then [View Window].
• This displays the current View Window settings.
(2) Change the View Window settings, if you want.
•See “Configuring View Window Parameters for the Graph Window” on page 3-2-1 for
information about using the View Window.
(3) After the settings are the way you want, tap [OK] to apply them.