
User Manual
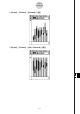
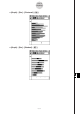
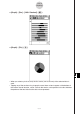
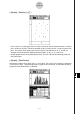
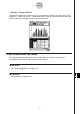
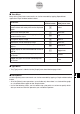
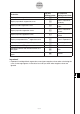
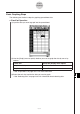
Table Of Contents
- Getting Ready
- Contents
- About This User’s Guide
- Chapter 1 Getting Acquainted
- Chapter 2 Using the Main Application
- 2-1 Main Application Overview
- 2-2 Basic Calculations
- 2-3 Using the Calculation History
- 2-4 Function Calculations
- 2-5 List Calculations
- 2-6 Matrix and Vector Calculations
- 2-7 Using the Action Menu
- 2-8 Using the Interactive Menu
- 2-9 Using the Main Application in Combination with Other Applications
- 2-10 Using Verify
- Chapter 3 Using the Graph & Table Application
- Chapter 4 Using the Conics Application
- Chapter 5 Using the 3D Graph Application
- Chapter 6 Using the Sequence Application
- Chapter 7 Using the Statistics Application
- 7-1 Statistics Application Overview
- 7-2 Using List Editor
- 7-3 Before Trying to Draw a Statistical Graph
- 7-4 Graphing Single-Variable Statistical Data
- 7-5 Graphing Paired-Variable Statistical Data
- 7-6 Using the Statistical Graph Window Toolbar
- 7-7 Performing Statistical Calculations
- 7-8 Test, Confidence Interval, and Distribution Calculations
- 7-9 Tests
- 7-10 Confidence Intervals
- 7-11 Distribution
- 7-12 Statistical System Variables
- Chapter 8 Using the Geometry Application
- Chapter 9 Using the Numeric Solver Application
- Chapter 10 Using the eActivity Application
- Chapter 11 Using the Presentation Application
- Chapter 12 Using the Program Application
- Chapter 13 Using the Spreadsheet Application
- Chapter 14 Using the Setup Menu
- Chapter 15 Configuring System Settings
- 15-1 System Setting Overview
- 15-2 Managing Memory Usage
- 15-3 Using the Reset Dialog Box
- 15-4 Initializing Your ClassPad
- 15-5 Adjusting Display Contrast
- 15-6 Configuring Power Properties
- 15-7 Specifying the Display Language
- 15-8 Specifying the Font Set
- 15-9 Specifying the Alphabetic Keyboard Arrangement
- 15-10 Optimizing “Flash ROM”
- 15-11 Specifying the Ending Screen Image
- 15-12 Adjusting Touch Panel Alignment
- 15-13 Viewing Version Information
- Chapter 16 Performing Data Communication
- Appendix
20050501
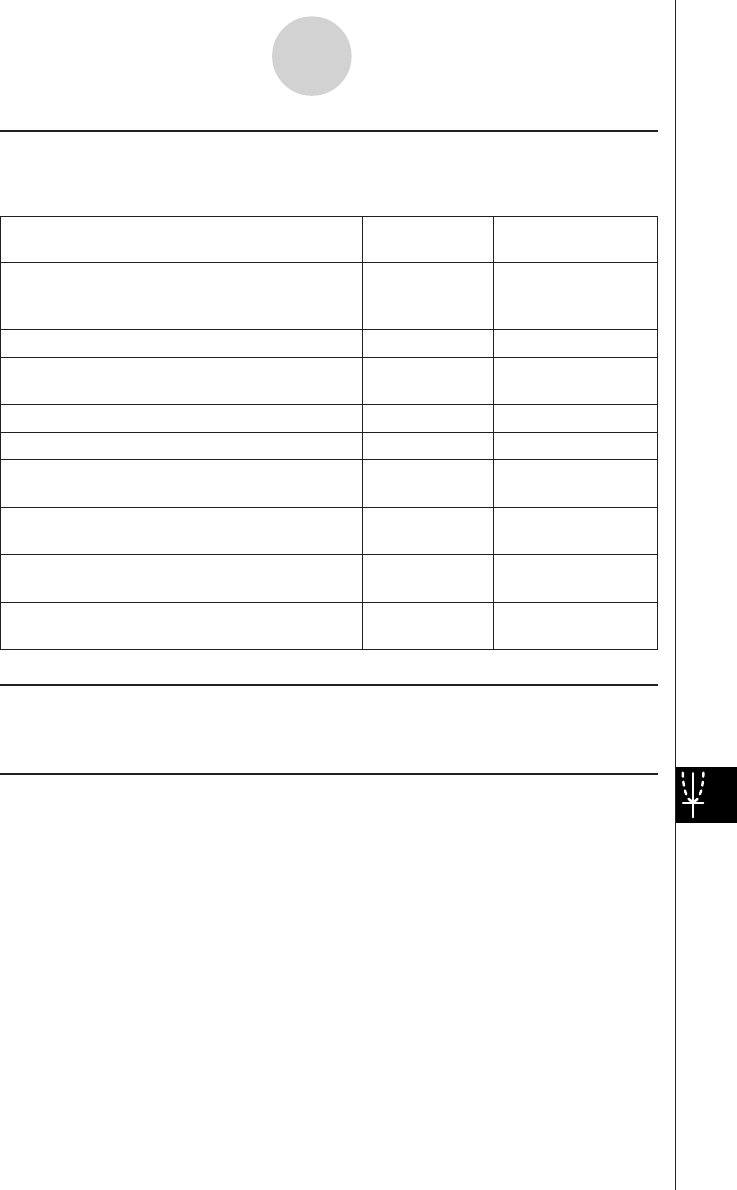
k View Menu
Many of the [View] menu commands can also be executed by tapping Spreadsheet
application Graph window toolbar buttons.
To do this:
Tap this Or select this
toolbar button: [View] menu item:
Change the function of the stylus so it can be
used to select and move points on the displayed G Select
graph
Start a box zoom operation Q Zoom Box
Activate the pan function for dragging the Graph
T Pan
window with the stylus
Enlarge the display image W Zoom In
Reduce the size of the display image E Zoom Out
Adjust the size of the display image so it fits the
R Zoom to Fit
display
Toggle display of axes and coordinate values on
q Toggle Axes
and off
Toggle line graph and scatter graph plot markers
—Markers
on and off
Toggle line graph and scatter connecting lines
—Lines
on and off
k Type Menu
• The [Type] menu is identical to the [Graph] menu described on page 13-8-1.
k Series Menu
All of the [Series] menu commands can also be executed by tapping a Graph window toolbar
button.
•All of the [Series] menu operations are available only when there is a clustered line graph
or a clustered column graph on the Graph window.
• In all of the following cases, you first need to tap a plot point or a column to specify which
data you want to use for the operation you are about to perform.
13-8-9
Graphing