
User Manual
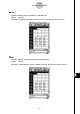
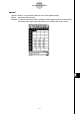
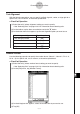
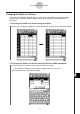
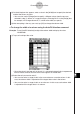
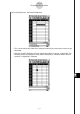
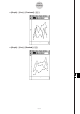
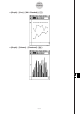
Table Of Contents
- Getting Ready
- Contents
- About This User’s Guide
- Chapter 1 Getting Acquainted
- Chapter 2 Using the Main Application
- 2-1 Main Application Overview
- 2-2 Basic Calculations
- 2-3 Using the Calculation History
- 2-4 Function Calculations
- 2-5 List Calculations
- 2-6 Matrix and Vector Calculations
- 2-7 Using the Action Menu
- 2-8 Using the Interactive Menu
- 2-9 Using the Main Application in Combination with Other Applications
- 2-10 Using Verify
- Chapter 3 Using the Graph & Table Application
- Chapter 4 Using the Conics Application
- Chapter 5 Using the 3D Graph Application
- Chapter 6 Using the Sequence Application
- Chapter 7 Using the Statistics Application
- 7-1 Statistics Application Overview
- 7-2 Using List Editor
- 7-3 Before Trying to Draw a Statistical Graph
- 7-4 Graphing Single-Variable Statistical Data
- 7-5 Graphing Paired-Variable Statistical Data
- 7-6 Using the Statistical Graph Window Toolbar
- 7-7 Performing Statistical Calculations
- 7-8 Test, Confidence Interval, and Distribution Calculations
- 7-9 Tests
- 7-10 Confidence Intervals
- 7-11 Distribution
- 7-12 Statistical System Variables
- Chapter 8 Using the Geometry Application
- Chapter 9 Using the Numeric Solver Application
- Chapter 10 Using the eActivity Application
- Chapter 11 Using the Presentation Application
- Chapter 12 Using the Program Application
- Chapter 13 Using the Spreadsheet Application
- Chapter 14 Using the Setup Menu
- Chapter 15 Configuring System Settings
- 15-1 System Setting Overview
- 15-2 Managing Memory Usage
- 15-3 Using the Reset Dialog Box
- 15-4 Initializing Your ClassPad
- 15-5 Adjusting Display Contrast
- 15-6 Configuring Power Properties
- 15-7 Specifying the Display Language
- 15-8 Specifying the Font Set
- 15-9 Specifying the Alphabetic Keyboard Arrangement
- 15-10 Optimizing “Flash ROM”
- 15-11 Specifying the Ending Screen Image
- 15-12 Adjusting Touch Panel Alignment
- 15-13 Viewing Version Information
- Chapter 16 Performing Data Communication
- Appendix

20050501
13-7-1
Formatting Cells and Data
13-7 Formatting Cells and Data
This section explains how to control the format of the spreadsheet and the data contained in
the cells.
Standard (Fractional) and Decimal (Approximate) Modes
You can use the following procedure to control whether a specific cell, row, or column, or the
entire spreadsheet should use the standard mode (fractional format) or decimal mode
(approximate value).
u ClassPad Operation
(1) Select the cell(s) whose format you want to specify.
•See “Selecting Cells” on page 13-3-5 for information about selecting cells.
(2) On the toolbar, tap the left button (,
/
.) to toggle between the standard mode and
the decimal mode.
Plain Text and Bold Text
Use the following procedure to toggle the text of a specific cell, row, or column, or the entire
spreadsheet between plain and bold.
u ClassPad Operation
(1) Select the cell(s) whose text setting you want to specify.
•See “Selecting Cells” on page 13-3-5 for information about selecting cells.
(2) On the toolbar, tap the M
/
B button to toggle between bold and plain text.
Text and Calculation Data Types
Make use of the following procedure to toggle a specific cell, row, or column, or the entire
spreadsheet for either text or calculation data types.
u ClassPad Operation
(1) Select the cell(s) whose format you want to specify.
•See “Selecting Cells” on page 13-3-5 for information about selecting cells.
(2) On the toolbar, tap the u
/
< button to toggle between Text Input mode and
Calculation Input mode.