
User Manual
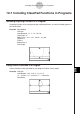
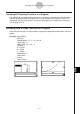
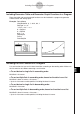
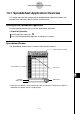
Table Of Contents
- Getting Ready
- Contents
- About This User’s Guide
- Chapter 1 Getting Acquainted
- Chapter 2 Using the Main Application
- 2-1 Main Application Overview
- 2-2 Basic Calculations
- 2-3 Using the Calculation History
- 2-4 Function Calculations
- 2-5 List Calculations
- 2-6 Matrix and Vector Calculations
- 2-7 Using the Action Menu
- 2-8 Using the Interactive Menu
- 2-9 Using the Main Application in Combination with Other Applications
- 2-10 Using Verify
- Chapter 3 Using the Graph & Table Application
- Chapter 4 Using the Conics Application
- Chapter 5 Using the 3D Graph Application
- Chapter 6 Using the Sequence Application
- Chapter 7 Using the Statistics Application
- 7-1 Statistics Application Overview
- 7-2 Using List Editor
- 7-3 Before Trying to Draw a Statistical Graph
- 7-4 Graphing Single-Variable Statistical Data
- 7-5 Graphing Paired-Variable Statistical Data
- 7-6 Using the Statistical Graph Window Toolbar
- 7-7 Performing Statistical Calculations
- 7-8 Test, Confidence Interval, and Distribution Calculations
- 7-9 Tests
- 7-10 Confidence Intervals
- 7-11 Distribution
- 7-12 Statistical System Variables
- Chapter 8 Using the Geometry Application
- Chapter 9 Using the Numeric Solver Application
- Chapter 10 Using the eActivity Application
- Chapter 11 Using the Presentation Application
- Chapter 12 Using the Program Application
- Chapter 13 Using the Spreadsheet Application
- Chapter 14 Using the Setup Menu
- Chapter 15 Configuring System Settings
- 15-1 System Setting Overview
- 15-2 Managing Memory Usage
- 15-3 Using the Reset Dialog Box
- 15-4 Initializing Your ClassPad
- 15-5 Adjusting Display Contrast
- 15-6 Configuring Power Properties
- 15-7 Specifying the Display Language
- 15-8 Specifying the Font Set
- 15-9 Specifying the Alphabetic Keyboard Arrangement
- 15-10 Optimizing “Flash ROM”
- 15-11 Specifying the Ending Screen Image
- 15-12 Adjusting Touch Panel Alignment
- 15-13 Viewing Version Information
- Chapter 16 Performing Data Communication
- Appendix
20050501
13-2-2
Spreadsheet Application Menus and Buttons
k Graph Menu
You can use the [Graph] menu to graph the data contained in selected cells. See
“13-8 Graphing” for more information.
k Action Menu
The [Action] menu contains a selection of functions that you can use when configuring a
spreadsheet. See “13-6 Using the Action Menu” for more information.
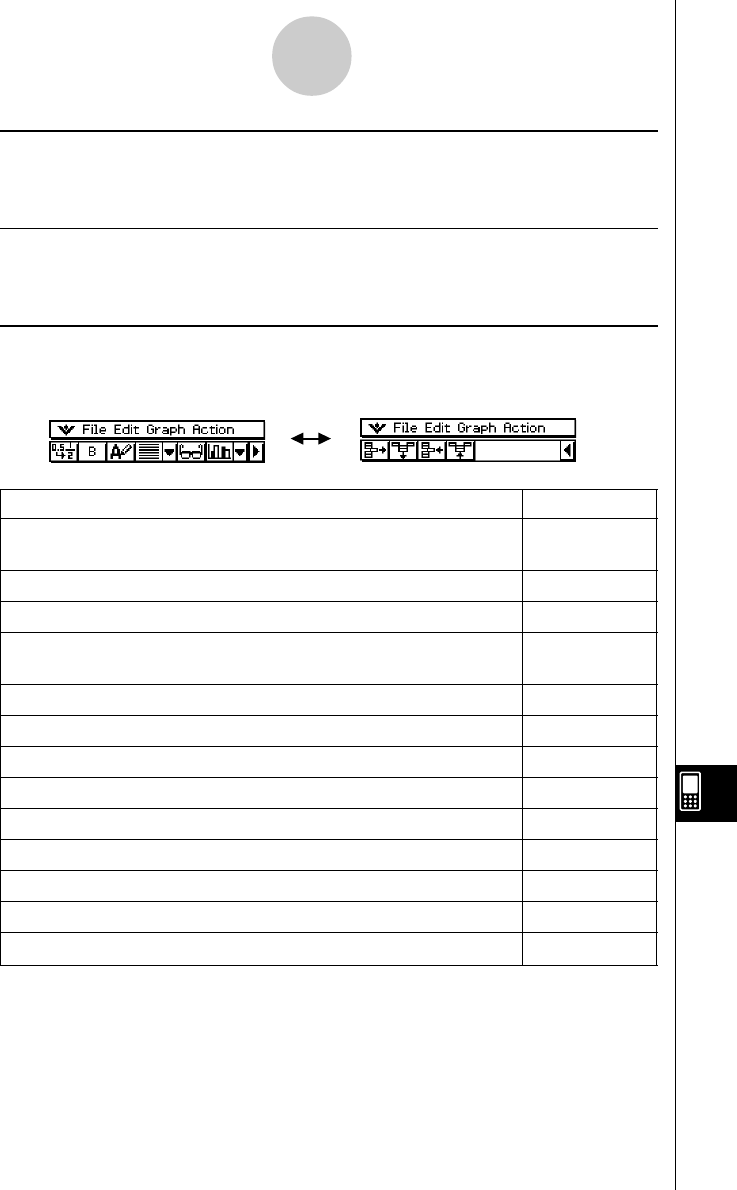
k Spreadsheet Toolbar Buttons
Not all of the Spreadsheet buttons can fit on a single toolbar, tap the u/t button on the far
right to toggle between the two toolbars.
To do this: Tap this button:
Toggle the selected cell(s) between decimal (floating point) and exact
.
/
,
display*
1
Toggle the selected cell(s) between bold and normal M
/
B
Toggle the data type of the selected cell(s) between text and calculation u
/
<
Specify left-justified text and right-justified values for selected cell(s)
[
(default)
Specify left-justified for selected cell(s) p
Specify centered for selected cell(s) x
Specify right-justified for selected cell(s) ]
Display or hide the Cell Viewer window A
Display the Spreadsheet Graph window (page 13-8-1) o
Delete the currently selected row(s) H
Delete the currently selected column(s) J
Insert row(s) K
Insert column(s) a
*
1
When cell(s) are calculation data types.
Tip
• During cell data input and editing, the toolbar changes to a data input toolbar. See “Edit Mode
Screen” on page 13-4-1 for more information.