
User Manual
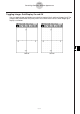
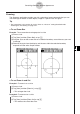
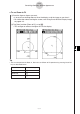
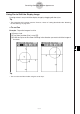
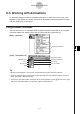
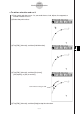
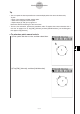
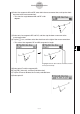
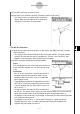
Table Of Contents
- Getting Ready
- Contents
- About This User’s Guide
- Chapter 1 Getting Acquainted
- Chapter 2 Using the Main Application
- 2-1 Main Application Overview
- 2-2 Basic Calculations
- 2-3 Using the Calculation History
- 2-4 Function Calculations
- 2-5 List Calculations
- 2-6 Matrix and Vector Calculations
- 2-7 Using the Action Menu
- 2-8 Using the Interactive Menu
- 2-9 Using the Main Application in Combination with Other Applications
- 2-10 Using Verify
- Chapter 3 Using the Graph & Table Application
- Chapter 4 Using the Conics Application
- Chapter 5 Using the 3D Graph Application
- Chapter 6 Using the Sequence Application
- Chapter 7 Using the Statistics Application
- 7-1 Statistics Application Overview
- 7-2 Using List Editor
- 7-3 Before Trying to Draw a Statistical Graph
- 7-4 Graphing Single-Variable Statistical Data
- 7-5 Graphing Paired-Variable Statistical Data
- 7-6 Using the Statistical Graph Window Toolbar
- 7-7 Performing Statistical Calculations
- 7-8 Test, Confidence Interval, and Distribution Calculations
- 7-9 Tests
- 7-10 Confidence Intervals
- 7-11 Distribution
- 7-12 Statistical System Variables
- Chapter 8 Using the Geometry Application
- Chapter 9 Using the Numeric Solver Application
- Chapter 10 Using the eActivity Application
- Chapter 11 Using the Presentation Application
- Chapter 12 Using the Program Application
- Chapter 13 Using the Spreadsheet Application
- Chapter 14 Using the Setup Menu
- Chapter 15 Configuring System Settings
- 15-1 System Setting Overview
- 15-2 Managing Memory Usage
- 15-3 Using the Reset Dialog Box
- 15-4 Initializing Your ClassPad
- 15-5 Adjusting Display Contrast
- 15-6 Configuring Power Properties
- 15-7 Specifying the Display Language
- 15-8 Specifying the Font Set
- 15-9 Specifying the Alphabetic Keyboard Arrangement
- 15-10 Optimizing “Flash ROM”
- 15-11 Specifying the Ending Screen Image
- 15-12 Adjusting Touch Panel Alignment
- 15-13 Viewing Version Information
- Chapter 16 Performing Data Communication
- Appendix
20050501
(4) Remove the stylus from the display and the area within the selection boundary
expands to fill the entire Graph window.
8-4-3
Controlling Geometry Window Appearance
u To use Zoom In and Out
Example 1: To zoom in on a circle
(1) Draw a circle.
(2) Tap [View] and then [Zoom In], or tap W.
• This enlarges the circle.
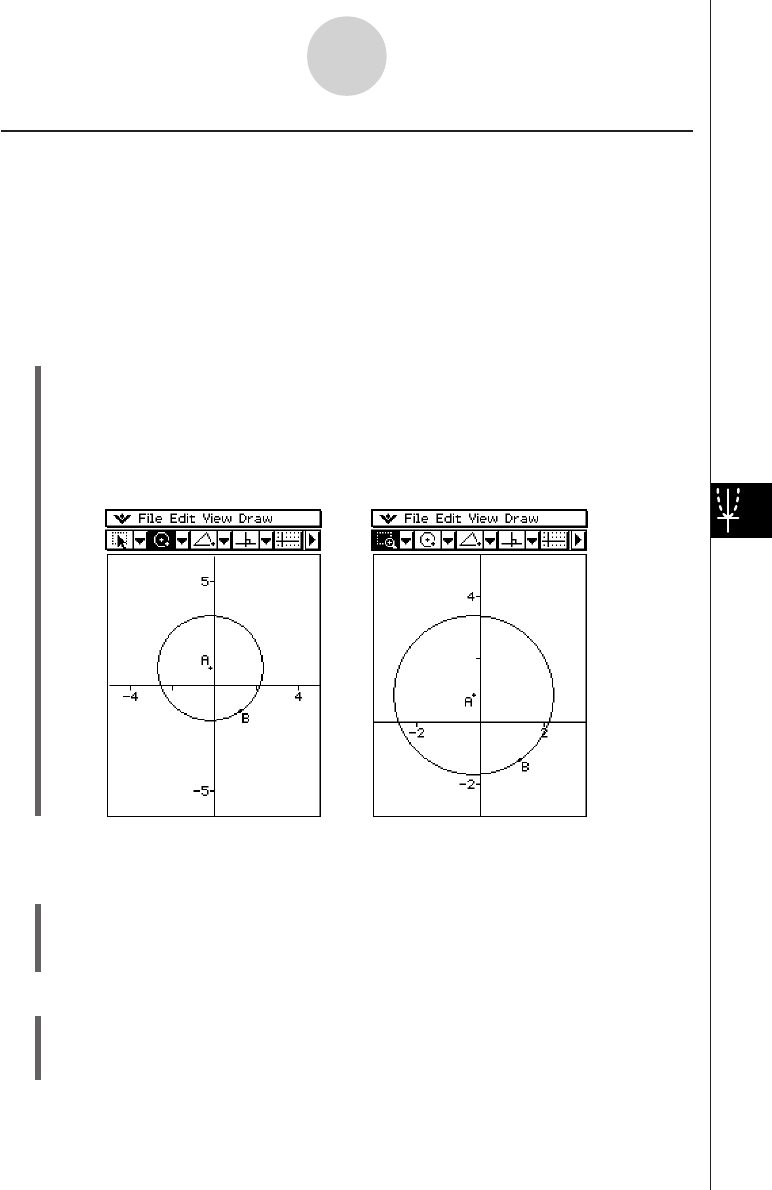
Example 2: To zoom out on a circle
(1) Draw a circle.
(2) Tap [View] and then [Zoom Out] or tap E.
• This reduces the size of the circle.
Zooming
The Geometry application provides you with a selection of zoom commands that you can
use to enlarge or reduce an entire display image or a specific area of a figure.
Tip
• The screenshots in this section all use the “Axes on, values on” setting described under
“Selecting the Axis Setting” on page 8-4-1.
u To use Zoom Box
Example: To use zoom box to enlarge part of a circle
(1) Draw a circle.
(2) Tap [View] and then [Zoom Box], or tap Q.
(3) Drag the stylus on the screen to draw a selection boundary around the area you want
to enlarge.