
User Manual
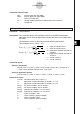
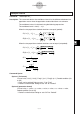
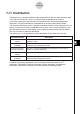
Table Of Contents
- Getting Ready
- Contents
- About This User’s Guide
- Chapter 1 Getting Acquainted
- Chapter 2 Using the Main Application
- 2-1 Main Application Overview
- 2-2 Basic Calculations
- 2-3 Using the Calculation History
- 2-4 Function Calculations
- 2-5 List Calculations
- 2-6 Matrix and Vector Calculations
- 2-7 Using the Action Menu
- 2-8 Using the Interactive Menu
- 2-9 Using the Main Application in Combination with Other Applications
- 2-10 Using Verify
- Chapter 3 Using the Graph & Table Application
- Chapter 4 Using the Conics Application
- Chapter 5 Using the 3D Graph Application
- Chapter 6 Using the Sequence Application
- Chapter 7 Using the Statistics Application
- 7-1 Statistics Application Overview
- 7-2 Using List Editor
- 7-3 Before Trying to Draw a Statistical Graph
- 7-4 Graphing Single-Variable Statistical Data
- 7-5 Graphing Paired-Variable Statistical Data
- 7-6 Using the Statistical Graph Window Toolbar
- 7-7 Performing Statistical Calculations
- 7-8 Test, Confidence Interval, and Distribution Calculations
- 7-9 Tests
- 7-10 Confidence Intervals
- 7-11 Distribution
- 7-12 Statistical System Variables
- Chapter 8 Using the Geometry Application
- Chapter 9 Using the Numeric Solver Application
- Chapter 10 Using the eActivity Application
- Chapter 11 Using the Presentation Application
- Chapter 12 Using the Program Application
- Chapter 13 Using the Spreadsheet Application
- Chapter 14 Using the Setup Menu
- Chapter 15 Configuring System Settings
- 15-1 System Setting Overview
- 15-2 Managing Memory Usage
- 15-3 Using the Reset Dialog Box
- 15-4 Initializing Your ClassPad
- 15-5 Adjusting Display Contrast
- 15-6 Configuring Power Properties
- 15-7 Specifying the Display Language
- 15-8 Specifying the Font Set
- 15-9 Specifying the Alphabetic Keyboard Arrangement
- 15-10 Optimizing “Flash ROM”
- 15-11 Specifying the Ending Screen Image
- 15-12 Adjusting Touch Panel Alignment
- 15-13 Viewing Version Information
- Chapter 16 Performing Data Communication
- Appendix

20050501
Definition of Terms
C-Level : confidence level (0 < C-Level < 1)
List(1) : list where sample 1 data is located
List(2) : list where sample 2 data is located
Freq(1) : frequency of sample 1 (1 or list name)
Freq(2) : frequency of sample 2 (1 or list name)
Pooled : On or Off
o1 : mean of sample 1 data
x1
σ
n-1 : standard deviation of sample 1 (x1
σ
n-1 > 0)
n1 : size of sample 1 (positive integer)
o2 : mean of sample 2 data
x2
σ
n-1 : standard deviation of sample 2 (x2
σ
n-1 > 0)
n2 : size of sample 2 (positive integer)
Input Example:
Syntax 1 (list format)
TwoSampleTInt 0.95,list1,list2,1,1,Off
Syntax 2 (parameter format)
TwoSampleTInt 0.95,80.4,2.07,30,84.2,1.96,35,On
Calculation Result Output
Left : interval lower limit (left edge)
Right : interval upper limit (right edge)
df : degrees of freedom
o1 : mean of sample 1 data
o2 : mean of sample 2 data
x1
σ
n–1 : standard deviation of sample 1
x2
σ
n–1 : standard deviation of sample 2
xp
σ
n–1 : pooled sample standard deviation (Displayed only when pooling is
turned on.)
n1 : size of sample 1
n2 : size of sample 2
7-10-8
Confidence Intervals