
User Manual
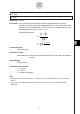
Table Of Contents
- Getting Ready
- Contents
- About This User’s Guide
- Chapter 1 Getting Acquainted
- Chapter 2 Using the Main Application
- 2-1 Main Application Overview
- 2-2 Basic Calculations
- 2-3 Using the Calculation History
- 2-4 Function Calculations
- 2-5 List Calculations
- 2-6 Matrix and Vector Calculations
- 2-7 Using the Action Menu
- 2-8 Using the Interactive Menu
- 2-9 Using the Main Application in Combination with Other Applications
- 2-10 Using Verify
- Chapter 3 Using the Graph & Table Application
- Chapter 4 Using the Conics Application
- Chapter 5 Using the 3D Graph Application
- Chapter 6 Using the Sequence Application
- Chapter 7 Using the Statistics Application
- 7-1 Statistics Application Overview
- 7-2 Using List Editor
- 7-3 Before Trying to Draw a Statistical Graph
- 7-4 Graphing Single-Variable Statistical Data
- 7-5 Graphing Paired-Variable Statistical Data
- 7-6 Using the Statistical Graph Window Toolbar
- 7-7 Performing Statistical Calculations
- 7-8 Test, Confidence Interval, and Distribution Calculations
- 7-9 Tests
- 7-10 Confidence Intervals
- 7-11 Distribution
- 7-12 Statistical System Variables
- Chapter 8 Using the Geometry Application
- Chapter 9 Using the Numeric Solver Application
- Chapter 10 Using the eActivity Application
- Chapter 11 Using the Presentation Application
- Chapter 12 Using the Program Application
- Chapter 13 Using the Spreadsheet Application
- Chapter 14 Using the Setup Menu
- Chapter 15 Configuring System Settings
- 15-1 System Setting Overview
- 15-2 Managing Memory Usage
- 15-3 Using the Reset Dialog Box
- 15-4 Initializing Your ClassPad
- 15-5 Adjusting Display Contrast
- 15-6 Configuring Power Properties
- 15-7 Specifying the Display Language
- 15-8 Specifying the Font Set
- 15-9 Specifying the Alphabetic Keyboard Arrangement
- 15-10 Optimizing “Flash ROM”
- 15-11 Specifying the Ending Screen Image
- 15-12 Adjusting Touch Panel Alignment
- 15-13 Viewing Version Information
- Chapter 16 Performing Data Communication
- Appendix
20050501
7-9-11
Tests
k 2-Sample F Test
2-Sample F Test
Command: TwoSampleFTest䡺
Description: This command tests hypotheses concerning the ratio of the population
variance of two populations. A 2-Sample F Test uses F distribution.
F =
x
1 n–1
2
σ
x
2 n–1
2
σ
Command Syntax
Syntax 1 (list format)
“
σ
1 condition”, List(1), List(2), Freq(1) (or 1), Freq(2) (or 1)
* “Freq” can be omitted. Doing so sets “1” for “Freq”.
Syntax 2 (parameter format)
“
σ
1 condition”, x1
σ
n–1 value, n1 value, x2
σ
n–1 value, n2 value
Definition of Terms
σ
1 condition: population standard deviation test conditions (“≠” specifies two-tail
test, “<” specifies one-tail test where sample 1 is smaller than
sample 2, “>” specifies one-tail test where sample 1 is greater than
sample 2.)
List(1) : list where sample 1 data is located
List(2) : list where sample 2 data is located
Freq(1) : frequency of sample 1 (1 or list name)
Freq(2) : frequency of sample 2 (1 or list name)
x1
σ
n-1 : standard deviation of sample 1 (x1
σ
n-1 > 0)
n1 : size of sample 1 (positive integer)
x2
σ
n-1 : standard deviation of sample 2 (x2
σ
n-1 > 0)
n2 : size of sample 2 (positive integer)
Input Example:
Syntax 1 (list format)
TwoSampleFTest “≠”,list1,list2,1,1
Syntax 2 (parameter format)
TwoSampleFTest “≠”,1.94,10,2.12,15
Calculation Result Output
σ
1 ≠
σ
2 : test condition
F : F value
p : p-value
o1 : mean of sample 1 (Displayed only for list format.)
o2 : mean of sample 2 (Displayed only for list format.)
x1
σ
n–1 : standard deviation of sample 1
x2
σ
n–1 : standard deviation of sample 2
n1 : size of sample 1
n2 : size of sample 2