
User Manual
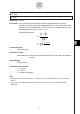
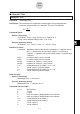
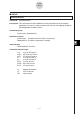
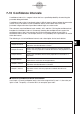
Table Of Contents
- Getting Ready
- Contents
- About This User’s Guide
- Chapter 1 Getting Acquainted
- Chapter 2 Using the Main Application
- 2-1 Main Application Overview
- 2-2 Basic Calculations
- 2-3 Using the Calculation History
- 2-4 Function Calculations
- 2-5 List Calculations
- 2-6 Matrix and Vector Calculations
- 2-7 Using the Action Menu
- 2-8 Using the Interactive Menu
- 2-9 Using the Main Application in Combination with Other Applications
- 2-10 Using Verify
- Chapter 3 Using the Graph & Table Application
- Chapter 4 Using the Conics Application
- Chapter 5 Using the 3D Graph Application
- Chapter 6 Using the Sequence Application
- Chapter 7 Using the Statistics Application
- 7-1 Statistics Application Overview
- 7-2 Using List Editor
- 7-3 Before Trying to Draw a Statistical Graph
- 7-4 Graphing Single-Variable Statistical Data
- 7-5 Graphing Paired-Variable Statistical Data
- 7-6 Using the Statistical Graph Window Toolbar
- 7-7 Performing Statistical Calculations
- 7-8 Test, Confidence Interval, and Distribution Calculations
- 7-9 Tests
- 7-10 Confidence Intervals
- 7-11 Distribution
- 7-12 Statistical System Variables
- Chapter 8 Using the Geometry Application
- Chapter 9 Using the Numeric Solver Application
- Chapter 10 Using the eActivity Application
- Chapter 11 Using the Presentation Application
- Chapter 12 Using the Program Application
- Chapter 13 Using the Spreadsheet Application
- Chapter 14 Using the Setup Menu
- Chapter 15 Configuring System Settings
- 15-1 System Setting Overview
- 15-2 Managing Memory Usage
- 15-3 Using the Reset Dialog Box
- 15-4 Initializing Your ClassPad
- 15-5 Adjusting Display Contrast
- 15-6 Configuring Power Properties
- 15-7 Specifying the Display Language
- 15-8 Specifying the Font Set
- 15-9 Specifying the Alphabetic Keyboard Arrangement
- 15-10 Optimizing “Flash ROM”
- 15-11 Specifying the Ending Screen Image
- 15-12 Adjusting Touch Panel Alignment
- 15-13 Viewing Version Information
- Chapter 16 Performing Data Communication
- Appendix

20050501
2-Sample t Test
Command: TwoSampleTTest䡺
Description: This command compares the population means of two populations when
population standard deviation is unknown. A 2-Sample t Test is used for t
distribution.
t =
o
1
– o
2
x
1 n–1
2
σ
n
1
+
x
2 n–1
2
σ
n
2
o1 : mean of sample 1 data
o2 : mean of sample 2 data
x1
σ
n-1 : standard deviation of sample 1
x2
σ
n-1 : standard deviation of sample 2
n1 : size of sample 1
n2 : size of sample 2
This formula is applicable when the population standard deviations of the two
populations are not equal. The denominator is different when the population
standard deviations are equal.
The t distribution degrees of freedom df and xp
σ
n-1 differ according to whether
the population standard deviations of the two populations are equal.
When the two population standard deviations are equal (pooled)
df
= n1 + n2 – 2
x
p n–1
=
σ
n
1
+ n
2
– 2
(n
1
–1)x
1
n–1
2
+(n
2
–1)x
2
n–1
2
σ
σ
When the two population standard deviations are not equal (not pooled)
df =
1
C
2
n
1
–1
+
(1–C )
2
n
2
–1
C =
x
1 n–1
2
σ
n
1
+
x
2 n–1
2
σ
n
2
x
1 n–1
2
σ
n
1
Command Syntax
Syntax 1 (list format)
“
µ
1 condition”, List(1), List(2), Freq(1) (or 1), Freq(2) (or 1), Pooled condition (On
or Off)
* “Freq” can be omitted. Doing so sets “1” for “Freq”.
* “Pooled” can be omitted. Doing so sets “Off” for “Pooled”.
Syntax 2 (parameter format)
“
µ
1 condition”, o1 value, x1
σ
n-1 value, n1 value, o2 value, x2
σ
n-1 value, n2 value,
Pooled condition (On or Off)
* “Pooled” can be omitted. Doing so sets “Off” for “Pooled”.
7-9-7
Tests