
User Manual
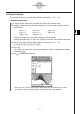
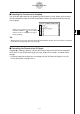
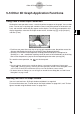
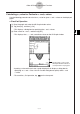
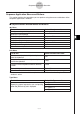
Table Of Contents
- Getting Ready
- Contents
- About This User’s Guide
- Chapter 1 Getting Acquainted
- Chapter 2 Using the Main Application
- 2-1 Main Application Overview
- 2-2 Basic Calculations
- 2-3 Using the Calculation History
- 2-4 Function Calculations
- 2-5 List Calculations
- 2-6 Matrix and Vector Calculations
- 2-7 Using the Action Menu
- 2-8 Using the Interactive Menu
- 2-9 Using the Main Application in Combination with Other Applications
- 2-10 Using Verify
- Chapter 3 Using the Graph & Table Application
- Chapter 4 Using the Conics Application
- Chapter 5 Using the 3D Graph Application
- Chapter 6 Using the Sequence Application
- Chapter 7 Using the Statistics Application
- 7-1 Statistics Application Overview
- 7-2 Using List Editor
- 7-3 Before Trying to Draw a Statistical Graph
- 7-4 Graphing Single-Variable Statistical Data
- 7-5 Graphing Paired-Variable Statistical Data
- 7-6 Using the Statistical Graph Window Toolbar
- 7-7 Performing Statistical Calculations
- 7-8 Test, Confidence Interval, and Distribution Calculations
- 7-9 Tests
- 7-10 Confidence Intervals
- 7-11 Distribution
- 7-12 Statistical System Variables
- Chapter 8 Using the Geometry Application
- Chapter 9 Using the Numeric Solver Application
- Chapter 10 Using the eActivity Application
- Chapter 11 Using the Presentation Application
- Chapter 12 Using the Program Application
- Chapter 13 Using the Spreadsheet Application
- Chapter 14 Using the Setup Menu
- Chapter 15 Configuring System Settings
- 15-1 System Setting Overview
- 15-2 Managing Memory Usage
- 15-3 Using the Reset Dialog Box
- 15-4 Initializing Your ClassPad
- 15-5 Adjusting Display Contrast
- 15-6 Configuring Power Properties
- 15-7 Specifying the Display Language
- 15-8 Specifying the Font Set
- 15-9 Specifying the Alphabetic Keyboard Arrangement
- 15-10 Optimizing “Flash ROM”
- 15-11 Specifying the Ending Screen Image
- 15-12 Adjusting Touch Panel Alignment
- 15-13 Viewing Version Information
- Chapter 16 Performing Data Communication
- Appendix
20050501
5-4-2
Manipulating a Graph on the 3D Graph Window
• To view the graph facing the z-axis, tap [Zoom] and then
[View-z], or press the Z key.
Rotating the Graph Manually
Use the procedures described below to rotate the displayed graph manually.
To do this:
Rotate the graph to the left
Rotate the graph to the right
Rotate the graph upwards
Rotate the graph downwards
Press the left cursor key or tap the left graph
controller arrow.
Press the right cursor key or tap the right
graph controller arrow.
Press the up cursor key or tap the up graph
controller arrow.
Press the down cursor key or tap the down
graph controller arrow.
Do this:
• Holding down a key or graph controller arrow will rotate the graph continuously.
Rotating a Graph Automatically
You can use the following procedure to rotate a graph automatically for about 30 seconds.
u ClassPad Operation
(1) To start automatic graph rotation, tap a and then [Rotating].
(2) On the submenu that appears, select the rotation direction you want:
[Left → Right], [Right → Left], [Top → Bottom], or [Bottom → Top].
•Rotation continues for about 30 seconds and then stops automatically. You can also stop
automatic rotation by pressing the c key or tapping on the icon panel.
Initializing the Graph Window
To return the 3D Graph window to its initial default settings, including its View Window
settings, tap [Zoom] and then [View-Init].