
User Manual
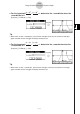
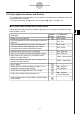
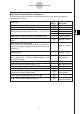
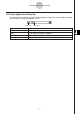
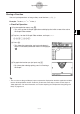
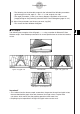
Table Of Contents
- Getting Ready
- Contents
- About This User’s Guide
- Chapter 1 Getting Acquainted
- Chapter 2 Using the Main Application
- 2-1 Main Application Overview
- 2-2 Basic Calculations
- 2-3 Using the Calculation History
- 2-4 Function Calculations
- 2-5 List Calculations
- 2-6 Matrix and Vector Calculations
- 2-7 Using the Action Menu
- 2-8 Using the Interactive Menu
- 2-9 Using the Main Application in Combination with Other Applications
- 2-10 Using Verify
- Chapter 3 Using the Graph & Table Application
- Chapter 4 Using the Conics Application
- Chapter 5 Using the 3D Graph Application
- Chapter 6 Using the Sequence Application
- Chapter 7 Using the Statistics Application
- 7-1 Statistics Application Overview
- 7-2 Using List Editor
- 7-3 Before Trying to Draw a Statistical Graph
- 7-4 Graphing Single-Variable Statistical Data
- 7-5 Graphing Paired-Variable Statistical Data
- 7-6 Using the Statistical Graph Window Toolbar
- 7-7 Performing Statistical Calculations
- 7-8 Test, Confidence Interval, and Distribution Calculations
- 7-9 Tests
- 7-10 Confidence Intervals
- 7-11 Distribution
- 7-12 Statistical System Variables
- Chapter 8 Using the Geometry Application
- Chapter 9 Using the Numeric Solver Application
- Chapter 10 Using the eActivity Application
- Chapter 11 Using the Presentation Application
- Chapter 12 Using the Program Application
- Chapter 13 Using the Spreadsheet Application
- Chapter 14 Using the Setup Menu
- Chapter 15 Configuring System Settings
- 15-1 System Setting Overview
- 15-2 Managing Memory Usage
- 15-3 Using the Reset Dialog Box
- 15-4 Initializing Your ClassPad
- 15-5 Adjusting Display Contrast
- 15-6 Configuring Power Properties
- 15-7 Specifying the Display Language
- 15-8 Specifying the Font Set
- 15-9 Specifying the Alphabetic Keyboard Arrangement
- 15-10 Optimizing “Flash ROM”
- 15-11 Specifying the Ending Screen Image
- 15-12 Adjusting Touch Panel Alignment
- 15-13 Viewing Version Information
- Chapter 16 Performing Data Communication
- Appendix

20050501
5-3-1
Drawing a 3D Graph
5-3 Drawing a 3D Graph
This section explains how to draw a 3D graph, as well as how to change the angle of a graph
and how to rotate a graph.
Configuring 3D Graph View Window Parameters
3D Graph View Window parameters let you specify the maximum and minimum values for
the x-, y- and z-axis. You can also specify the number of lines you would like for drawing the
grid.
• For the xgrid enter the number of lines you would like drawn within the interval from xmin to
xmax. For example, if xmin = −3, xmax = 3 and xgrid= 15, 15 almost vertical lines will be
used to display your graph. The ygrid lines will be almost horizontal.
•After drawing a 3D graph, pressing the = key cycles the 3D Graph [Axes] setting (page
14-3-6) in the following sequence: “Off” → “On” → “Box” → “Off”, and so on.
Before drawing a graph, be sure to first configure View Window parameters as required to
ensure proper display of the graph.
u ClassPad Operation
(1) On the application menu, tap D.
• This starts up the 3D Graph application and displays the initial screen of the active 3D
Graph Editor window.
(2) Tap 7 to display the View Window dialog box.
(3) Configure the View Window parameters as described below.
•Press c to move the cursor and input an appropriate value for each parameter.
Use this
item:
Initial
default
To configure this View Window parameter:
xmin
xmax
xgrid
ymin
ymax
ygrid
zmin
Minimum
x
-axis value
Maximum
x
-axis value
Number of grid lines used for
x
-axis direction
Minimum
y
-axis value
Maximum
y
-axis value
Number of grid lines used for
y
-axis direction
Minimum
z
-axis value
zmax Maximum
z
-axis value
angle Clockwise angle of
x
-axis
angle
Eye position relative to the plane created by
the
x
-axis and
y
-axis, and the angle of the
z
-axis
φ
θ
–3
3
25
–3
3
25
–3
3
20
70