
User Manual
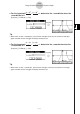
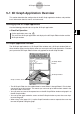
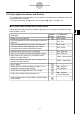
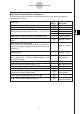
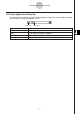
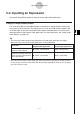
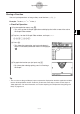
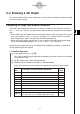
Table Of Contents
- Getting Ready
- Contents
- About This User’s Guide
- Chapter 1 Getting Acquainted
- Chapter 2 Using the Main Application
- 2-1 Main Application Overview
- 2-2 Basic Calculations
- 2-3 Using the Calculation History
- 2-4 Function Calculations
- 2-5 List Calculations
- 2-6 Matrix and Vector Calculations
- 2-7 Using the Action Menu
- 2-8 Using the Interactive Menu
- 2-9 Using the Main Application in Combination with Other Applications
- 2-10 Using Verify
- Chapter 3 Using the Graph & Table Application
- Chapter 4 Using the Conics Application
- Chapter 5 Using the 3D Graph Application
- Chapter 6 Using the Sequence Application
- Chapter 7 Using the Statistics Application
- 7-1 Statistics Application Overview
- 7-2 Using List Editor
- 7-3 Before Trying to Draw a Statistical Graph
- 7-4 Graphing Single-Variable Statistical Data
- 7-5 Graphing Paired-Variable Statistical Data
- 7-6 Using the Statistical Graph Window Toolbar
- 7-7 Performing Statistical Calculations
- 7-8 Test, Confidence Interval, and Distribution Calculations
- 7-9 Tests
- 7-10 Confidence Intervals
- 7-11 Distribution
- 7-12 Statistical System Variables
- Chapter 8 Using the Geometry Application
- Chapter 9 Using the Numeric Solver Application
- Chapter 10 Using the eActivity Application
- Chapter 11 Using the Presentation Application
- Chapter 12 Using the Program Application
- Chapter 13 Using the Spreadsheet Application
- Chapter 14 Using the Setup Menu
- Chapter 15 Configuring System Settings
- 15-1 System Setting Overview
- 15-2 Managing Memory Usage
- 15-3 Using the Reset Dialog Box
- 15-4 Initializing Your ClassPad
- 15-5 Adjusting Display Contrast
- 15-6 Configuring Power Properties
- 15-7 Specifying the Display Language
- 15-8 Specifying the Font Set
- 15-9 Specifying the Alphabetic Keyboard Arrangement
- 15-10 Optimizing “Flash ROM”
- 15-11 Specifying the Ending Screen Image
- 15-12 Adjusting Touch Panel Alignment
- 15-13 Viewing Version Information
- Chapter 16 Performing Data Communication
- Appendix
20050501
5-2-1
Inputting an Expression
5-2 Inputting an Expression
Use the 3D Graph Editor window to input 3D Graph application expressions.
Using 3D Graph Editor Sheets
The 3D Graph Editor has five tabbed sheets named Sheet 1 through Sheet 5. Each sheet
can contain up to 20 functions. This means you can have up to 100 functions stored in the
3D Graph Editor at one time. 3D Graph Editor window sheet operations are similar to the
sheet operations of the Graph & Table application. For more information, see “Using Graph
Editor Sheets” on page 3-3-1.
Tip
• The commands used to perform sheet operations in the 3D Graph application are slightly
different to those in the Graph & Table application, as described below.
To do this:
Execute this command in the
Graph & Table application:
Execute this command in
the 3D Graph application:
a - Sheet - Default Name Sheet - Default Name
a - Sheet - Clear Sheet Sheet - Clear Sheet
Return the name of the active
sheet to its initial default
Return the contents and name
of the currently active sheet to
their initial defaults
• Also note that the Graph & Table application allows simultaneous graphing of multiple functions,
as long as they are on the same sheet. With the 3D Graph application, however, you can graph
only one function at a time.