
User Manual
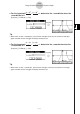
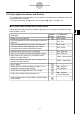
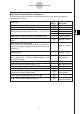
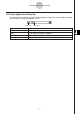
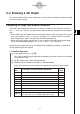
Table Of Contents
- Getting Ready
- Contents
- About This User’s Guide
- Chapter 1 Getting Acquainted
- Chapter 2 Using the Main Application
- 2-1 Main Application Overview
- 2-2 Basic Calculations
- 2-3 Using the Calculation History
- 2-4 Function Calculations
- 2-5 List Calculations
- 2-6 Matrix and Vector Calculations
- 2-7 Using the Action Menu
- 2-8 Using the Interactive Menu
- 2-9 Using the Main Application in Combination with Other Applications
- 2-10 Using Verify
- Chapter 3 Using the Graph & Table Application
- Chapter 4 Using the Conics Application
- Chapter 5 Using the 3D Graph Application
- Chapter 6 Using the Sequence Application
- Chapter 7 Using the Statistics Application
- 7-1 Statistics Application Overview
- 7-2 Using List Editor
- 7-3 Before Trying to Draw a Statistical Graph
- 7-4 Graphing Single-Variable Statistical Data
- 7-5 Graphing Paired-Variable Statistical Data
- 7-6 Using the Statistical Graph Window Toolbar
- 7-7 Performing Statistical Calculations
- 7-8 Test, Confidence Interval, and Distribution Calculations
- 7-9 Tests
- 7-10 Confidence Intervals
- 7-11 Distribution
- 7-12 Statistical System Variables
- Chapter 8 Using the Geometry Application
- Chapter 9 Using the Numeric Solver Application
- Chapter 10 Using the eActivity Application
- Chapter 11 Using the Presentation Application
- Chapter 12 Using the Program Application
- Chapter 13 Using the Spreadsheet Application
- Chapter 14 Using the Setup Menu
- Chapter 15 Configuring System Settings
- 15-1 System Setting Overview
- 15-2 Managing Memory Usage
- 15-3 Using the Reset Dialog Box
- 15-4 Initializing Your ClassPad
- 15-5 Adjusting Display Contrast
- 15-6 Configuring Power Properties
- 15-7 Specifying the Display Language
- 15-8 Specifying the Font Set
- 15-9 Specifying the Alphabetic Keyboard Arrangement
- 15-10 Optimizing “Flash ROM”
- 15-11 Specifying the Ending Screen Image
- 15-12 Adjusting Touch Panel Alignment
- 15-13 Viewing Version Information
- Chapter 16 Performing Data Communication
- Appendix
20050501
5-1-3
3D Graph Application Overview
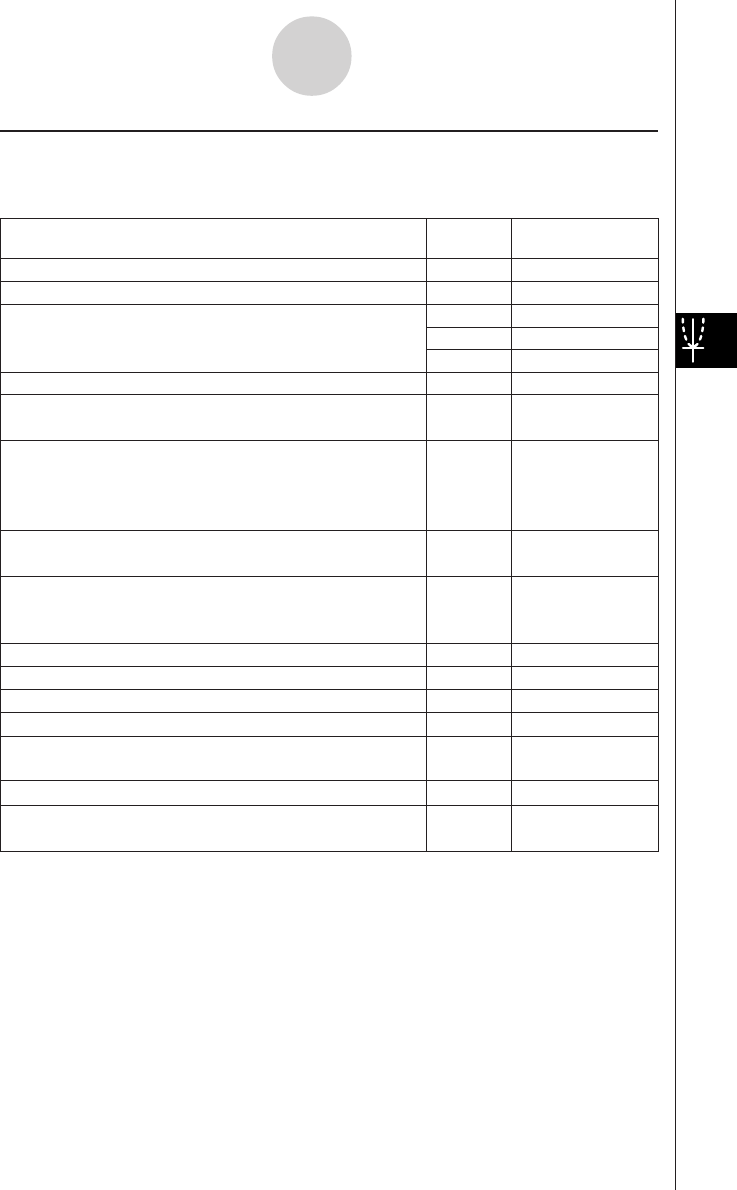
k 3D Graph Window Menus and Buttons
The following describes the menu and button operations you can perform while the 3D
Graph window is active.
To do this:
Tap this
button:
Or select this
menu item:
W
Zoom - Zoom In
E
Zoom - Zoom Out
— Zoom - View-
x
— Zoom - View-y
— Zoom - View-z
— Zoom - View-Init
=
Analysis - Trace
—Analysis - Sketch
—
a - Rotating
Enlarge the displayed graph
Reduce the size of the displayed graph
View the displayed graph from the
x-axis, y-axis, or z-axis
Return the 3D Graph window to its initial default state
— a - Store Picture
Save a graph as image data (page 3-2-10)
— a - Recall Picture
Recall the image of a graph (page 3-2-10)
— a - ReDraw
O - Settings -
View Window
O - Settings -
Variable Manager
Re-draw a graph
@
—
Make the 3D Graph Editor window active
7
Display the View Window dialog box (page 5-3-1) to
configure 3D Graph window settings
~
—
Display the Main application work area window
5
Display the Variable Manager (page 1-8-1)
Display the coordinates at a particular point on a 3D
graph
Write text on the Graph window
•See “To write text on the Graph window” on page 3-6-2,
and “To clear figures inserted using the Sketch menu” on
page 3-6-5.
—Analysis -
z-Cal
Calculate a
z-value for given x- and y-values on the
displayed graph
Automatically rotate a graph in the specified direction
(Left → Right, Right → Left, Top → Bottom, Bottom → Top)
for about 30 seconds