
User Manual
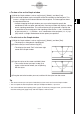
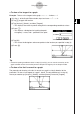
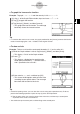
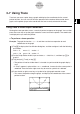
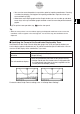
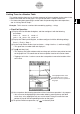
Table Of Contents
- Getting Ready
- Contents
- About This User’s Guide
- Chapter 1 Getting Acquainted
- Chapter 2 Using the Main Application
- 2-1 Main Application Overview
- 2-2 Basic Calculations
- 2-3 Using the Calculation History
- 2-4 Function Calculations
- 2-5 List Calculations
- 2-6 Matrix and Vector Calculations
- 2-7 Using the Action Menu
- 2-8 Using the Interactive Menu
- 2-9 Using the Main Application in Combination with Other Applications
- 2-10 Using Verify
- Chapter 3 Using the Graph & Table Application
- Chapter 4 Using the Conics Application
- Chapter 5 Using the 3D Graph Application
- Chapter 6 Using the Sequence Application
- Chapter 7 Using the Statistics Application
- 7-1 Statistics Application Overview
- 7-2 Using List Editor
- 7-3 Before Trying to Draw a Statistical Graph
- 7-4 Graphing Single-Variable Statistical Data
- 7-5 Graphing Paired-Variable Statistical Data
- 7-6 Using the Statistical Graph Window Toolbar
- 7-7 Performing Statistical Calculations
- 7-8 Test, Confidence Interval, and Distribution Calculations
- 7-9 Tests
- 7-10 Confidence Intervals
- 7-11 Distribution
- 7-12 Statistical System Variables
- Chapter 8 Using the Geometry Application
- Chapter 9 Using the Numeric Solver Application
- Chapter 10 Using the eActivity Application
- Chapter 11 Using the Presentation Application
- Chapter 12 Using the Program Application
- Chapter 13 Using the Spreadsheet Application
- Chapter 14 Using the Setup Menu
- Chapter 15 Configuring System Settings
- 15-1 System Setting Overview
- 15-2 Managing Memory Usage
- 15-3 Using the Reset Dialog Box
- 15-4 Initializing Your ClassPad
- 15-5 Adjusting Display Contrast
- 15-6 Configuring Power Properties
- 15-7 Specifying the Display Language
- 15-8 Specifying the Font Set
- 15-9 Specifying the Alphabetic Keyboard Arrangement
- 15-10 Optimizing “Flash ROM”
- 15-11 Specifying the Ending Screen Image
- 15-12 Adjusting Touch Panel Alignment
- 15-13 Viewing Version Information
- Chapter 16 Performing Data Communication
- Appendix
20050501
•You can also move the pointer to a particular point by inputting coordinates. Pressing
a number key displays a dialog box for inputting coordinates. Input the values you
want and then tap [OK].
•When there are multiple graphs on the Graph window, you can use the up and down
cursor keys or the up and down graph controller arrows to move the pointer between
graphs.
(5) To quit the trace operation, tap on the icon panel.
Tip
• While the trace pointer is on the window, tapping the displayed coordinate values causes the
coordinate values to appear in the message box. You can then copy the coordinates to the
clipboard.
k Specifying the Format of the Coordinates Displayed by Trace
Check boxes on the Graph Format dialog box (page 14-3-4) let you specify whether you
want to display pointer coordinates only, or pointer coordinates plus the derivative. You can
also turn off the display of the coordinates, if you want.
3-7-2
Using Trace
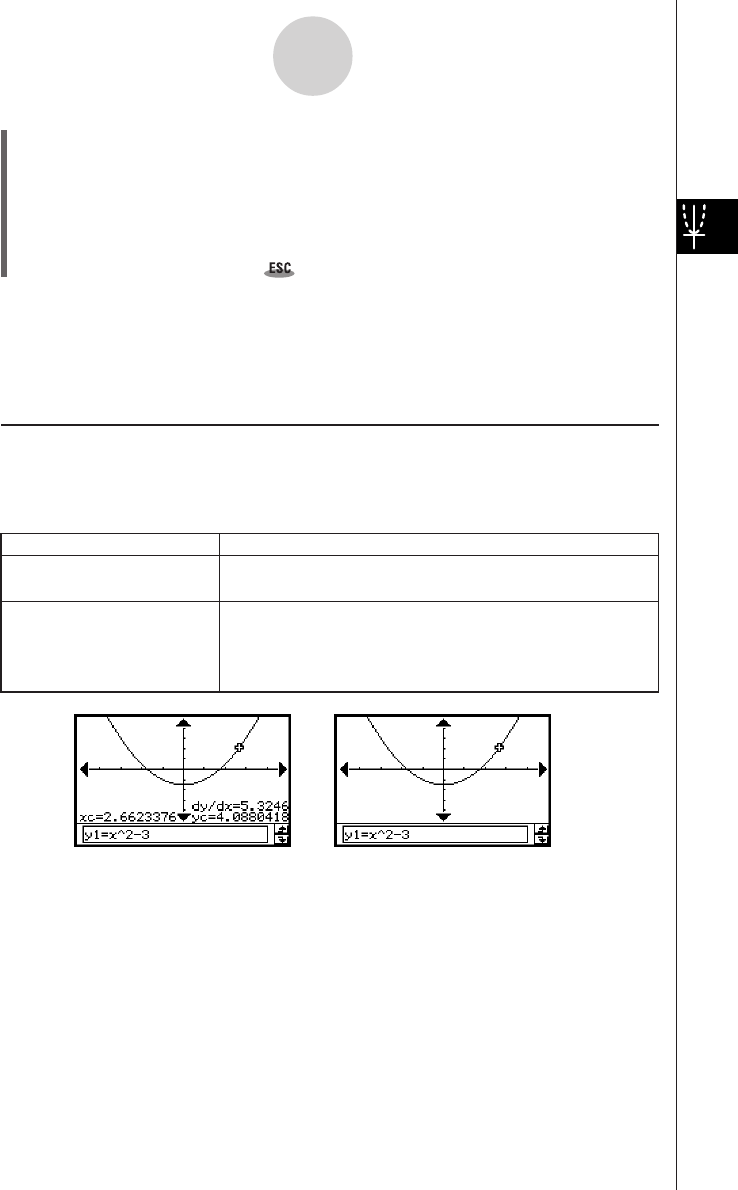
Tu rn off coordinate display
Display coordinates and the
derivative
Select the [Derivative/Slope] check box under
[Graph Format].
Clear the [Coordinate] check box under [Graph Format].
• Neither coordinates nor the derivative is displayed when
the [Coordinate] check box is cleared, regardless of the
current [Derivative/Slope] setting.
Do this:
To do this:
For details about Graph Format settings, see “14-3 Setup Menu Settings”.