
User Manual
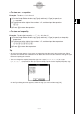
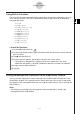
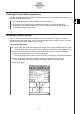
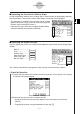


Table Of Contents
- Getting Ready
- Contents
- About This User’s Guide
- Chapter 1 Getting Acquainted
- Chapter 2 Using the Main Application
- 2-1 Main Application Overview
- 2-2 Basic Calculations
- 2-3 Using the Calculation History
- 2-4 Function Calculations
- 2-5 List Calculations
- 2-6 Matrix and Vector Calculations
- 2-7 Using the Action Menu
- 2-8 Using the Interactive Menu
- 2-9 Using the Main Application in Combination with Other Applications
- 2-10 Using Verify
- Chapter 3 Using the Graph & Table Application
- Chapter 4 Using the Conics Application
- Chapter 5 Using the 3D Graph Application
- Chapter 6 Using the Sequence Application
- Chapter 7 Using the Statistics Application
- 7-1 Statistics Application Overview
- 7-2 Using List Editor
- 7-3 Before Trying to Draw a Statistical Graph
- 7-4 Graphing Single-Variable Statistical Data
- 7-5 Graphing Paired-Variable Statistical Data
- 7-6 Using the Statistical Graph Window Toolbar
- 7-7 Performing Statistical Calculations
- 7-8 Test, Confidence Interval, and Distribution Calculations
- 7-9 Tests
- 7-10 Confidence Intervals
- 7-11 Distribution
- 7-12 Statistical System Variables
- Chapter 8 Using the Geometry Application
- Chapter 9 Using the Numeric Solver Application
- Chapter 10 Using the eActivity Application
- Chapter 11 Using the Presentation Application
- Chapter 12 Using the Program Application
- Chapter 13 Using the Spreadsheet Application
- Chapter 14 Using the Setup Menu
- Chapter 15 Configuring System Settings
- 15-1 System Setting Overview
- 15-2 Managing Memory Usage
- 15-3 Using the Reset Dialog Box
- 15-4 Initializing Your ClassPad
- 15-5 Adjusting Display Contrast
- 15-6 Configuring Power Properties
- 15-7 Specifying the Display Language
- 15-8 Specifying the Font Set
- 15-9 Specifying the Alphabetic Keyboard Arrangement
- 15-10 Optimizing “Flash ROM”
- 15-11 Specifying the Ending Screen Image
- 15-12 Adjusting Touch Panel Alignment
- 15-13 Viewing Version Information
- Chapter 16 Performing Data Communication
- Appendix
20050501
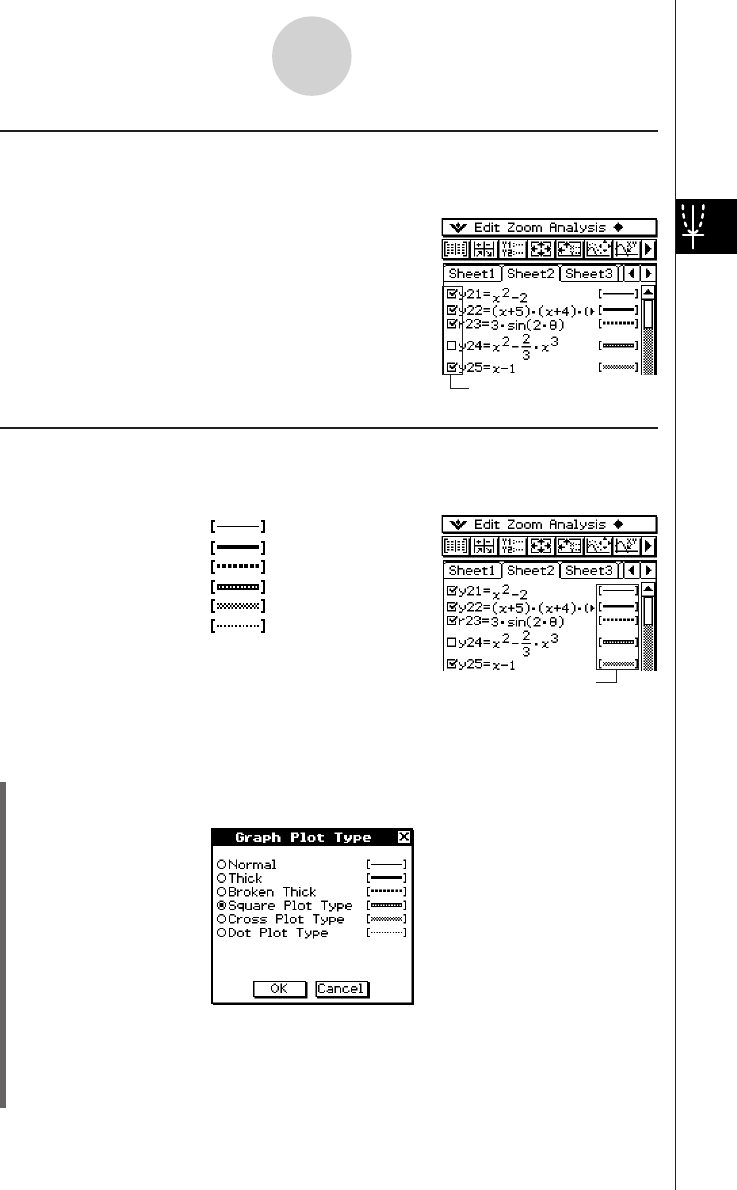
k Specifying the Function You Want to Graph
On the Graph Editor window, you can select one or more functions for graphing by selecting
their check boxes. The functions whose check boxes are cleared are not graphed.
• This check box is selected, so the function next to it will be
graphed when you tap $. If you do not want to graph this
function, tap the check box to clear it.
•Each time you tap a check box, it toggles between being
selected (checked) and cleared (unchecked).
k Specifying the Graph Line Style
You can specify one of the six line styles shown below for each function on the Graph Editor
window.
Normal ..........................
Thick .............................
Broken Thick ................
Square Plot Type ..........
Cross Plot Type ............
Dot Plot Type ................
The currently selected line style appears in the line style area next to each function.
u ClassPad Operation
(1) Tap the line style next to the function whose line style you want to specify. This displays
the Graph Plot Type dialog box.
3-3-8
Storing Functions
Line style area
Check box
(2) Select the line style you want, and then tap [OK].
•A preview of the line style you select appears in the line style area next to the
function.
•To graph the function using the selected line style, tap $.