
User Manual
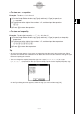
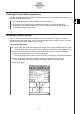
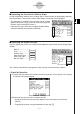

Table Of Contents
- Getting Ready
- Contents
- About This User’s Guide
- Chapter 1 Getting Acquainted
- Chapter 2 Using the Main Application
- 2-1 Main Application Overview
- 2-2 Basic Calculations
- 2-3 Using the Calculation History
- 2-4 Function Calculations
- 2-5 List Calculations
- 2-6 Matrix and Vector Calculations
- 2-7 Using the Action Menu
- 2-8 Using the Interactive Menu
- 2-9 Using the Main Application in Combination with Other Applications
- 2-10 Using Verify
- Chapter 3 Using the Graph & Table Application
- Chapter 4 Using the Conics Application
- Chapter 5 Using the 3D Graph Application
- Chapter 6 Using the Sequence Application
- Chapter 7 Using the Statistics Application
- 7-1 Statistics Application Overview
- 7-2 Using List Editor
- 7-3 Before Trying to Draw a Statistical Graph
- 7-4 Graphing Single-Variable Statistical Data
- 7-5 Graphing Paired-Variable Statistical Data
- 7-6 Using the Statistical Graph Window Toolbar
- 7-7 Performing Statistical Calculations
- 7-8 Test, Confidence Interval, and Distribution Calculations
- 7-9 Tests
- 7-10 Confidence Intervals
- 7-11 Distribution
- 7-12 Statistical System Variables
- Chapter 8 Using the Geometry Application
- Chapter 9 Using the Numeric Solver Application
- Chapter 10 Using the eActivity Application
- Chapter 11 Using the Presentation Application
- Chapter 12 Using the Program Application
- Chapter 13 Using the Spreadsheet Application
- Chapter 14 Using the Setup Menu
- Chapter 15 Configuring System Settings
- 15-1 System Setting Overview
- 15-2 Managing Memory Usage
- 15-3 Using the Reset Dialog Box
- 15-4 Initializing Your ClassPad
- 15-5 Adjusting Display Contrast
- 15-6 Configuring Power Properties
- 15-7 Specifying the Display Language
- 15-8 Specifying the Font Set
- 15-9 Specifying the Alphabetic Keyboard Arrangement
- 15-10 Optimizing “Flash ROM”
- 15-11 Specifying the Ending Screen Image
- 15-12 Adjusting Touch Panel Alignment
- 15-13 Viewing Version Information
- Chapter 16 Performing Data Communication
- Appendix
20050501
Deleting All Graph Editor Expressions
Use the following procedure to delete all of the expressions on all Graph Editor sheets, and
initialize all of the sheet names.
(1) On the Graph Editor window, tap [Edit] and then [Clear All].
(2) In response to the confirmation dialog box that appears, tap [OK] to delete all
expressions and initialize sheet names. To cancel the operation without deleting or
initializing anything, tap [Cancel].
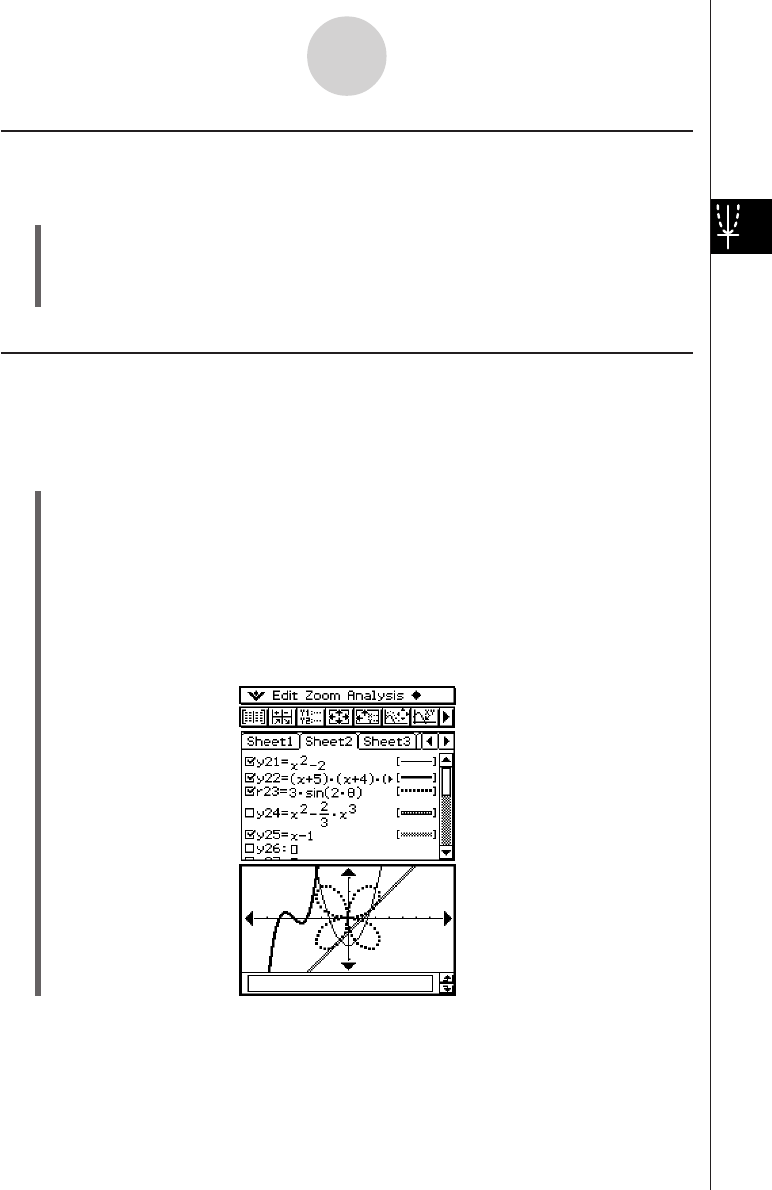
Graphing a Stored Function
You can select multiple functions and graph them simultaneously, as long as all of the
functions are on the same sheet. You can turn graphing of each function on or off, and even
specify the line style to be used for each function.
u ClassPad Operation
(1) Tap the tab of the sheet that contains the functions you want to graph to make it active.
• If the functions you want to graph are on Sheet 2, for example, tap the [Sheet 2] tab.
(2) Select the check boxes of all the functions you want to graph, and clear the check
boxes of all the functions you do not want to graph.
•See “Specifying the Function You Want to Graph” on page 3-3-8 for more information.
(3) You can tap the current line style given to specify another style, if you want.
•See “Specifying the Graph Line Style” on page 3-3-8 for more information.
(4) Tap $ to graph.
3-3-7
Storing Functions