
User Manual
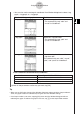
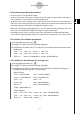
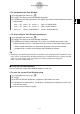
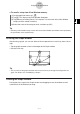
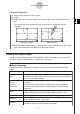
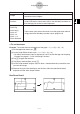
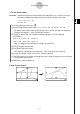
Table Of Contents
- Getting Ready
- Contents
- About This User’s Guide
- Chapter 1 Getting Acquainted
- Chapter 2 Using the Main Application
- 2-1 Main Application Overview
- 2-2 Basic Calculations
- 2-3 Using the Calculation History
- 2-4 Function Calculations
- 2-5 List Calculations
- 2-6 Matrix and Vector Calculations
- 2-7 Using the Action Menu
- 2-8 Using the Interactive Menu
- 2-9 Using the Main Application in Combination with Other Applications
- 2-10 Using Verify
- Chapter 3 Using the Graph & Table Application
- Chapter 4 Using the Conics Application
- Chapter 5 Using the 3D Graph Application
- Chapter 6 Using the Sequence Application
- Chapter 7 Using the Statistics Application
- 7-1 Statistics Application Overview
- 7-2 Using List Editor
- 7-3 Before Trying to Draw a Statistical Graph
- 7-4 Graphing Single-Variable Statistical Data
- 7-5 Graphing Paired-Variable Statistical Data
- 7-6 Using the Statistical Graph Window Toolbar
- 7-7 Performing Statistical Calculations
- 7-8 Test, Confidence Interval, and Distribution Calculations
- 7-9 Tests
- 7-10 Confidence Intervals
- 7-11 Distribution
- 7-12 Statistical System Variables
- Chapter 8 Using the Geometry Application
- Chapter 9 Using the Numeric Solver Application
- Chapter 10 Using the eActivity Application
- Chapter 11 Using the Presentation Application
- Chapter 12 Using the Program Application
- Chapter 13 Using the Spreadsheet Application
- Chapter 14 Using the Setup Menu
- Chapter 15 Configuring System Settings
- 15-1 System Setting Overview
- 15-2 Managing Memory Usage
- 15-3 Using the Reset Dialog Box
- 15-4 Initializing Your ClassPad
- 15-5 Adjusting Display Contrast
- 15-6 Configuring Power Properties
- 15-7 Specifying the Display Language
- 15-8 Specifying the Font Set
- 15-9 Specifying the Alphabetic Keyboard Arrangement
- 15-10 Optimizing “Flash ROM”
- 15-11 Specifying the Ending Screen Image
- 15-12 Adjusting Touch Panel Alignment
- 15-13 Viewing Version Information
- Chapter 16 Performing Data Communication
- Appendix
20050501
3-2-8
Using the Graph Window
u To use factor zoom
Example: To enlarge the graphs of the following two expressions, by a factor of 5 in both
directions, to determine whether they come into contact with each other
y1 = (x + 4)(x + 1)(x – 3)
y2 = 3x + 22
(1) On the application menu, tap
T
.
(2) On the Graph Editor window, input y1 = (x + 4)(x + 1)(x – 3) and y2 = 3x + 22.
• For details about how to input an expression, see “Function Storage and Graphing
Example” on page 3-1-7 and “3-3 Storing Functions”.
(3) Tap 6 to display the View Window, and then configure it with the following
parameters.
xmin = –8, xmax = 8, xscale = 1
ymin = –30, ymax = 30, yscale = 5
•See “To configure View Window parameters” on page 3-2-1.
(4) Tap $ to graph the functions.
(5) Tap [Zoom] and then [Factor].
• This displays a dialog box for configuring x- and y-axis zoom factor settings.
(6) Input 5 for both the xFactor and yFactor, and then tap [OK].
(7) Tap T, and then use the stylus to drag the screen image so the part you want to zoom
is in the center of the screen.
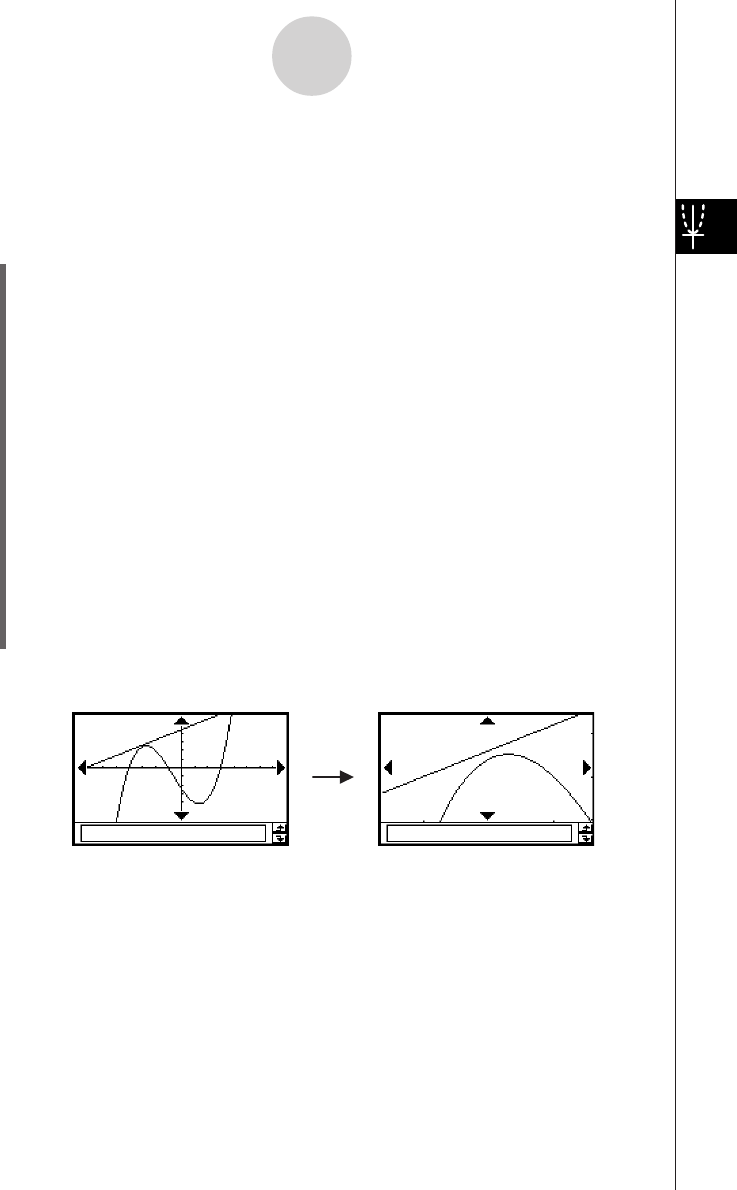
(8) Tap [Zoom] and then [Zoom In].
Factor Zoom Result