
User Manual
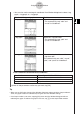
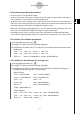
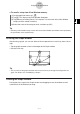
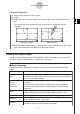
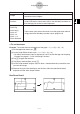
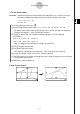
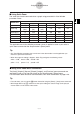
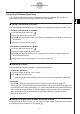
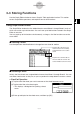
Table Of Contents
- Getting Ready
- Contents
- About This User’s Guide
- Chapter 1 Getting Acquainted
- Chapter 2 Using the Main Application
- 2-1 Main Application Overview
- 2-2 Basic Calculations
- 2-3 Using the Calculation History
- 2-4 Function Calculations
- 2-5 List Calculations
- 2-6 Matrix and Vector Calculations
- 2-7 Using the Action Menu
- 2-8 Using the Interactive Menu
- 2-9 Using the Main Application in Combination with Other Applications
- 2-10 Using Verify
- Chapter 3 Using the Graph & Table Application
- Chapter 4 Using the Conics Application
- Chapter 5 Using the 3D Graph Application
- Chapter 6 Using the Sequence Application
- Chapter 7 Using the Statistics Application
- 7-1 Statistics Application Overview
- 7-2 Using List Editor
- 7-3 Before Trying to Draw a Statistical Graph
- 7-4 Graphing Single-Variable Statistical Data
- 7-5 Graphing Paired-Variable Statistical Data
- 7-6 Using the Statistical Graph Window Toolbar
- 7-7 Performing Statistical Calculations
- 7-8 Test, Confidence Interval, and Distribution Calculations
- 7-9 Tests
- 7-10 Confidence Intervals
- 7-11 Distribution
- 7-12 Statistical System Variables
- Chapter 8 Using the Geometry Application
- Chapter 9 Using the Numeric Solver Application
- Chapter 10 Using the eActivity Application
- Chapter 11 Using the Presentation Application
- Chapter 12 Using the Program Application
- Chapter 13 Using the Spreadsheet Application
- Chapter 14 Using the Setup Menu
- Chapter 15 Configuring System Settings
- 15-1 System Setting Overview
- 15-2 Managing Memory Usage
- 15-3 Using the Reset Dialog Box
- 15-4 Initializing Your ClassPad
- 15-5 Adjusting Display Contrast
- 15-6 Configuring Power Properties
- 15-7 Specifying the Display Language
- 15-8 Specifying the Font Set
- 15-9 Specifying the Alphabetic Keyboard Arrangement
- 15-10 Optimizing “Flash ROM”
- 15-11 Specifying the Ending Screen Image
- 15-12 Adjusting Touch Panel Alignment
- 15-13 Viewing Version Information
- Chapter 16 Performing Data Communication
- Appendix
20050501
3-2-2
Using the Graph Window
Polar Coordinates and Parametric Coordinates
To select this type of graph:
x-log graph
y-log graph
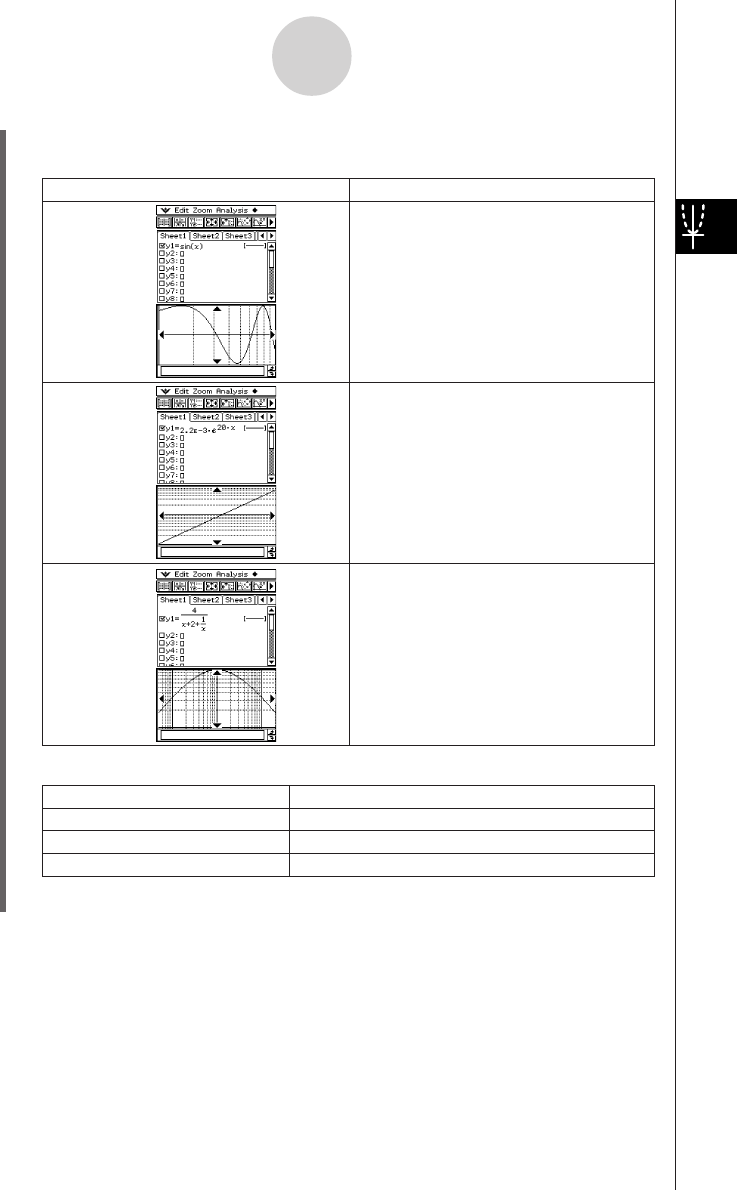
xy-log graph
Do this:
Select the
x-log check box.
• This automatically sets “xdot” and
“xscale” to “Undefined”.
Select the
y-log check box.
• This automatically sets “ydot” and
“yscale” to “Undefined”.
Select the
x-log check box and the
y-log check box.
This automatically sets “xdot”, “xscale”,
“ydot”, and “yscale” to “Undefined”.
Use this item:
t min
t max
t step
To configure this View Window parameter:
Minimum value of
t
Maximum value of
t
Step size of
t
θ
θ
θ
θ
θ
θ
(4) After all the parameters are the way you want, tap [OK].
Tip
• When you tap [OK] after changing View Window dialog box settings while the Graph window is
active, the graph is redrawn automatically using the new View Window settings.
• If the Graph window is not active, tapping [OK] closes the View Window dialog box without
redrawing the graph. To redraw the graph in this case, tap $ on the Graph Editor window.
•You can also use the rectangular coordinate View Window dialog box to select x-log
graph, y-log graph, or xy-log graph.