
User Manual

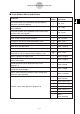
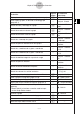
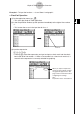
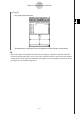
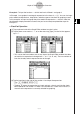
Table Of Contents
- Getting Ready
- Contents
- About This User’s Guide
- Chapter 1 Getting Acquainted
- Chapter 2 Using the Main Application
- 2-1 Main Application Overview
- 2-2 Basic Calculations
- 2-3 Using the Calculation History
- 2-4 Function Calculations
- 2-5 List Calculations
- 2-6 Matrix and Vector Calculations
- 2-7 Using the Action Menu
- 2-8 Using the Interactive Menu
- 2-9 Using the Main Application in Combination with Other Applications
- 2-10 Using Verify
- Chapter 3 Using the Graph & Table Application
- Chapter 4 Using the Conics Application
- Chapter 5 Using the 3D Graph Application
- Chapter 6 Using the Sequence Application
- Chapter 7 Using the Statistics Application
- 7-1 Statistics Application Overview
- 7-2 Using List Editor
- 7-3 Before Trying to Draw a Statistical Graph
- 7-4 Graphing Single-Variable Statistical Data
- 7-5 Graphing Paired-Variable Statistical Data
- 7-6 Using the Statistical Graph Window Toolbar
- 7-7 Performing Statistical Calculations
- 7-8 Test, Confidence Interval, and Distribution Calculations
- 7-9 Tests
- 7-10 Confidence Intervals
- 7-11 Distribution
- 7-12 Statistical System Variables
- Chapter 8 Using the Geometry Application
- Chapter 9 Using the Numeric Solver Application
- Chapter 10 Using the eActivity Application
- Chapter 11 Using the Presentation Application
- Chapter 12 Using the Program Application
- Chapter 13 Using the Spreadsheet Application
- Chapter 14 Using the Setup Menu
- Chapter 15 Configuring System Settings
- 15-1 System Setting Overview
- 15-2 Managing Memory Usage
- 15-3 Using the Reset Dialog Box
- 15-4 Initializing Your ClassPad
- 15-5 Adjusting Display Contrast
- 15-6 Configuring Power Properties
- 15-7 Specifying the Display Language
- 15-8 Specifying the Font Set
- 15-9 Specifying the Alphabetic Keyboard Arrangement
- 15-10 Optimizing “Flash ROM”
- 15-11 Specifying the Ending Screen Image
- 15-12 Adjusting Touch Panel Alignment
- 15-13 Viewing Version Information
- Chapter 16 Performing Data Communication
- Appendix
20050501
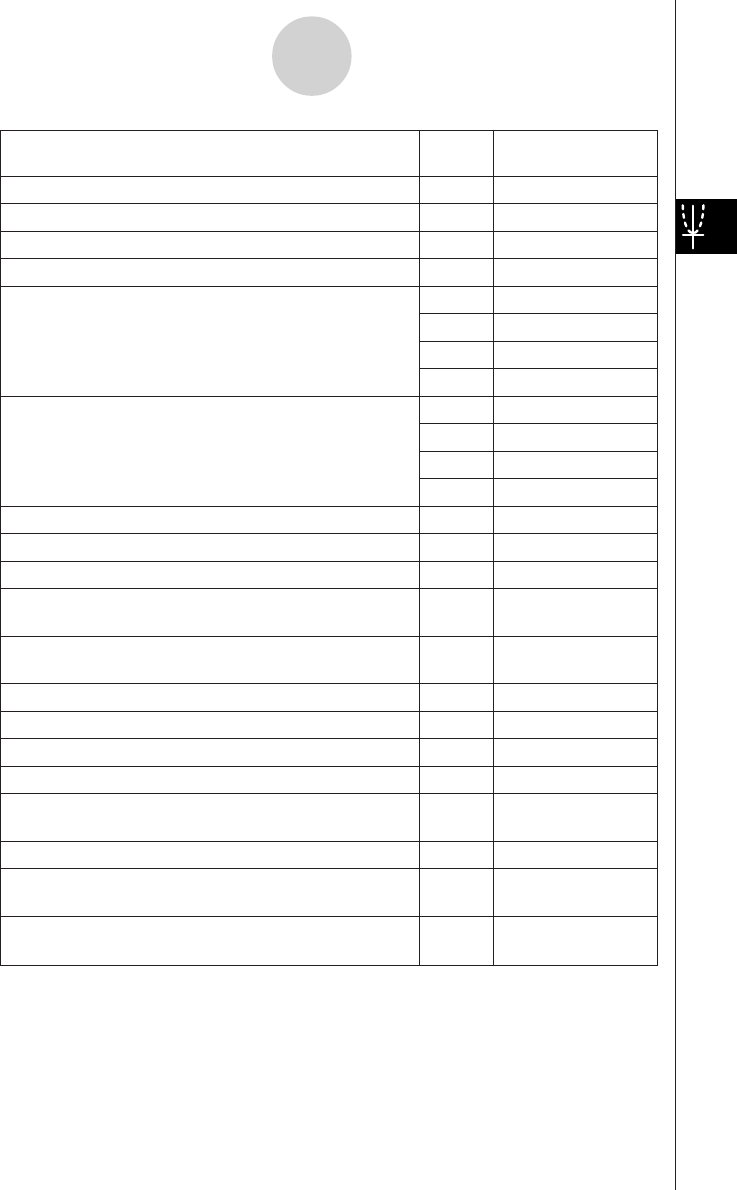
To do this:
Tap this Or select this
button: menu item:
Input a rectangular coordinate type function d Type - y= Type
Input a polar coordinate type function f Type - r= Type
Input a parametric function g Type - ParamType
Input an X equality h Type - x= Type
j Type - y> Type
Input a rectangular coordinate type inequality
l Type - y< Type
' Type - yt Type
X Type - ys Type
k Type - x> Type
Input an X inequality
; Type - x< Type
Z Type - xt Type
C Type - xs Type
Save all of the expressions on the Graph Editor window — GMem - Store
Recall batch saved data to the Graph Editor window — GMem - Recall
Use a built-in function for input — a - Built-In
Delete all of the expressions on the active sheet
—
a - Sheet -
Clear Sheet
Return all sheet names to their initial defaults
—
a - Sheet -
Default Name
Graph the selected function(s) $ —
Generate a table for the selected function # —
Generate a summary table for the selected function 4 —
Delete the selected function(s) q —
Display the View Window dialog box to configure Graph
6
O - Settings -
window settings View Window
Display the Table Input dialog box for configuring settings 8 —
Display the Variable Manager (page 1-8-1)
5
O - Settings -
Variable Manager
Save the current expression data (y1=, y2=, etc.) to
ClassPad memory
{ —
3-1-3
Graph & Table Application Overview