
User Manual
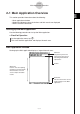
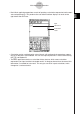
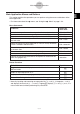

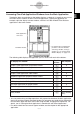
Table Of Contents
- Getting Ready
- Contents
- About This User’s Guide
- Chapter 1 Getting Acquainted
- Chapter 2 Using the Main Application
- 2-1 Main Application Overview
- 2-2 Basic Calculations
- 2-3 Using the Calculation History
- 2-4 Function Calculations
- 2-5 List Calculations
- 2-6 Matrix and Vector Calculations
- 2-7 Using the Action Menu
- 2-8 Using the Interactive Menu
- 2-9 Using the Main Application in Combination with Other Applications
- 2-10 Using Verify
- Chapter 3 Using the Graph & Table Application
- Chapter 4 Using the Conics Application
- Chapter 5 Using the 3D Graph Application
- Chapter 6 Using the Sequence Application
- Chapter 7 Using the Statistics Application
- 7-1 Statistics Application Overview
- 7-2 Using List Editor
- 7-3 Before Trying to Draw a Statistical Graph
- 7-4 Graphing Single-Variable Statistical Data
- 7-5 Graphing Paired-Variable Statistical Data
- 7-6 Using the Statistical Graph Window Toolbar
- 7-7 Performing Statistical Calculations
- 7-8 Test, Confidence Interval, and Distribution Calculations
- 7-9 Tests
- 7-10 Confidence Intervals
- 7-11 Distribution
- 7-12 Statistical System Variables
- Chapter 8 Using the Geometry Application
- Chapter 9 Using the Numeric Solver Application
- Chapter 10 Using the eActivity Application
- Chapter 11 Using the Presentation Application
- Chapter 12 Using the Program Application
- Chapter 13 Using the Spreadsheet Application
- Chapter 14 Using the Setup Menu
- Chapter 15 Configuring System Settings
- 15-1 System Setting Overview
- 15-2 Managing Memory Usage
- 15-3 Using the Reset Dialog Box
- 15-4 Initializing Your ClassPad
- 15-5 Adjusting Display Contrast
- 15-6 Configuring Power Properties
- 15-7 Specifying the Display Language
- 15-8 Specifying the Font Set
- 15-9 Specifying the Alphabetic Keyboard Arrangement
- 15-10 Optimizing “Flash ROM”
- 15-11 Specifying the Ending Screen Image
- 15-12 Adjusting Touch Panel Alignment
- 15-13 Viewing Version Information
- Chapter 16 Performing Data Communication
- Appendix
20050501
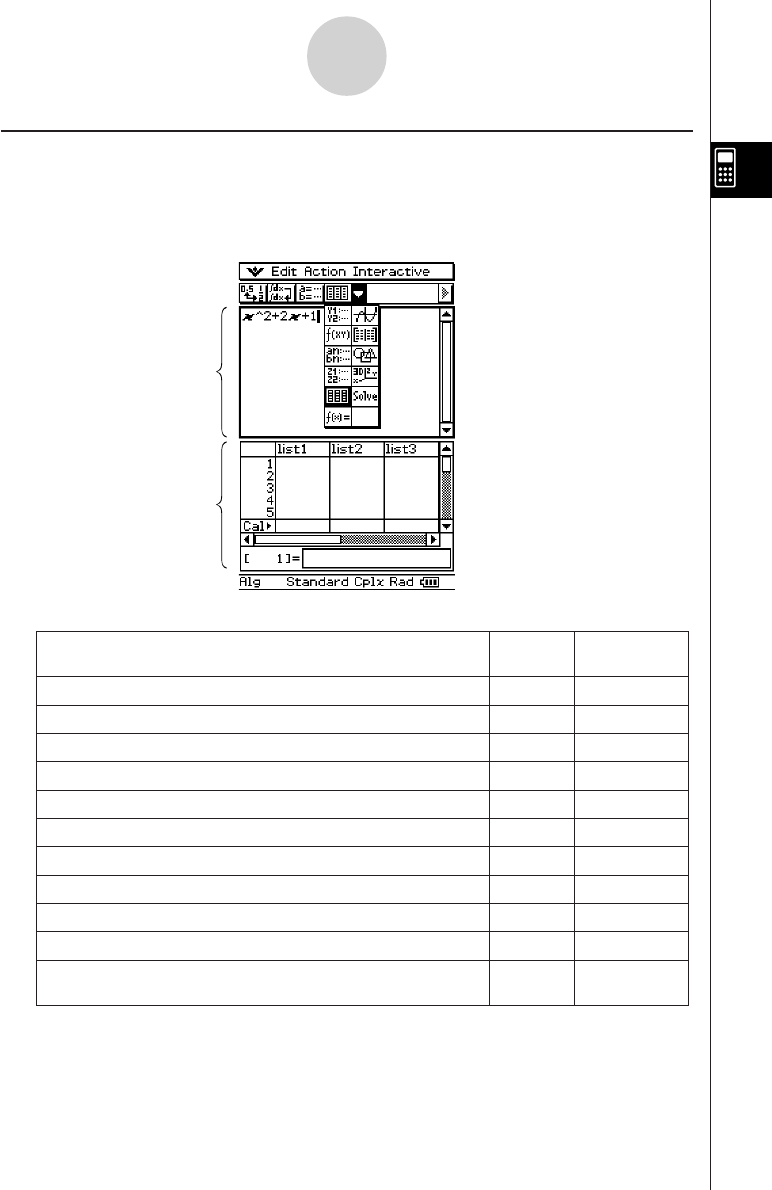
Accessing ClassPad Application Windows from the Main Application
Tapping the down arrow button on the toolbar displays a palette of 11 icons that you can use
to access certain windows of other ClassPad applications. Tapping the ( button, for
example, splits the display into two windows, with the List Editor window of the Statistics
application in the lower window.
2-1-5
Main Application Overview
The following table displays the application you can access with each of the buttons.
Main application
work area
List Editor window
• For details about swapping the
positions of the two windows,
activating a window, closing a
window, etc, see “Using a Dual
Window Display” on page 1-5-1.
To display this window:
Tap this
button:
See Chapter:
Graph & Table application Graph Editor window
!
3
Graph & Table application Graph window
$
3
Conics application Conics Editor window
*
4
Graph & Table application Table window
#
3
Sequence application Sequence Editor window
&
6
Geometry application Geometry window
3
8
3D Graph application 3D Graph Editor window
@
5
3D Graph application 3D Graph window
%
5
Statistics application List Editor window
(
7
Numeric Solver application Numeric Solver window
1
W
9
Verify window
See “2-10 Using
Verify”.
•You can perform drag and drop operations with expressions between the Main application
work area and the currently displayed window. For example, you could drag an expression
from the Main application work area to the Graph window, and graph the expression. For
details, see “2-9 Using the Main Application in Combination with Other Applications”.
• For details about how to use each type of window, see the chapter for the appropriate
application.