
User Manual
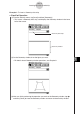

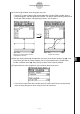

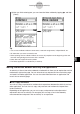
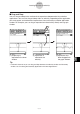
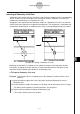

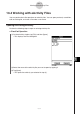
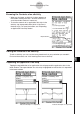
Table Of Contents
- Getting Ready
- Contents
- About This User’s Guide
- Chapter 1 Getting Acquainted
- Chapter 2 Using the Main Application
- 2-1 Main Application Overview
- 2-2 Basic Calculations
- 2-3 Using the Calculation History
- 2-4 Function Calculations
- 2-5 List Calculations
- 2-6 Matrix and Vector Calculations
- 2-7 Using the Action Menu
- 2-8 Using the Interactive Menu
- 2-9 Using the Main Application in Combination with Other Applications
- 2-10 Using Verify
- Chapter 3 Using the Graph & Table Application
- Chapter 4 Using the Conics Application
- Chapter 5 Using the 3D Graph Application
- Chapter 6 Using the Sequence Application
- Chapter 7 Using the Statistics Application
- 7-1 Statistics Application Overview
- 7-2 Using List Editor
- 7-3 Before Trying to Draw a Statistical Graph
- 7-4 Graphing Single-Variable Statistical Data
- 7-5 Graphing Paired-Variable Statistical Data
- 7-6 Using the Statistical Graph Window Toolbar
- 7-7 Performing Statistical Calculations
- 7-8 Test, Confidence Interval, and Distribution Calculations
- 7-9 Tests
- 7-10 Confidence Intervals
- 7-11 Distribution
- 7-12 Statistical System Variables
- Chapter 8 Using the Geometry Application
- Chapter 9 Using the Numeric Solver Application
- Chapter 10 Using the eActivity Application
- Chapter 11 Using the Presentation Application
- Chapter 12 Using the Program Application
- Chapter 13 Using the Spreadsheet Application
- Chapter 14 Using the Setup Menu
- Chapter 15 Configuring System Settings
- 15-1 System Setting Overview
- 15-2 Managing Memory Usage
- 15-3 Using the Reset Dialog Box
- 15-4 Initializing Your ClassPad
- 15-5 Adjusting Display Contrast
- 15-6 Configuring Power Properties
- 15-7 Specifying the Display Language
- 15-8 Specifying the Font Set
- 15-9 Specifying the Alphabetic Keyboard Arrangement
- 15-10 Optimizing “Flash ROM”
- 15-11 Specifying the Ending Screen Image
- 15-12 Adjusting Touch Panel Alignment
- 15-13 Viewing Version Information
- Chapter 16 Performing Data Communication
- Appendix
20050501
(4) Tap [Insert] and then [Geometry Link].
• This inserts a Geometry Link row in the next line.
10-3-13
Inserting Data into an eActivity
(5) Tap the Geometry window to make it active.
(6) Tap one side of the triangle to select it, and then drag it to the link symbol in the
eActivity window.
• This inputs the equation of the line that represents the side of the triangle into the link.
•Modifying the equation in the Geometry Link row and pressing E causes a corre-
sponding change in the Geometry window (lower right screenshot).
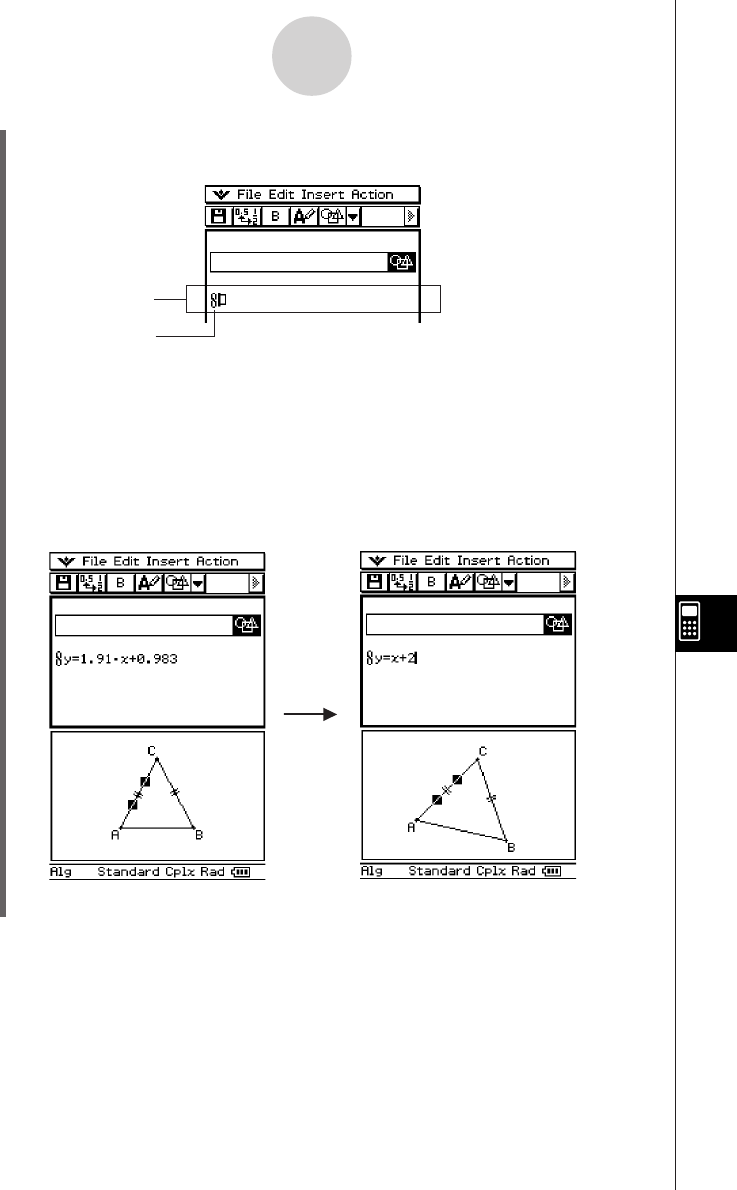
• The example below shows how the isosceles triangle ABC (CA = BC) changes when
the equation in the Geometry Link row is changed from y = 1.91x + 0.983 to y = x + 2.
Geometry Link row
Symbol
Tip
• Dragging a line or figure from the Geometry window to a text row or calculation row in an
eActivity also converts the figure to its value or equation. In this case, however, data in the text
row or calculation row is not interlinked with the Geometry window figure.
• Pressing E after changing data in a Geometry Link updates the corresponding figure in the
Geometry window.
• Changing the figure in the Geometry window will cause the linked data in an eActivity to update
accordingly.
• Drag the stylus across
1.91
x + 0.983.
• Input
x + 2.
• Press E.