
User Manual
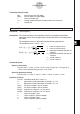
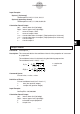
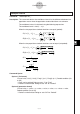
Table Of Contents
- Getting Ready
- Contents
- About This User’s Guide
- Chapter 1 Getting Acquainted
- Chapter 2 Using the Main Application
- 2-1 Main Application Overview
- 2-2 Basic Calculations
- 2-3 Using the Calculation History
- 2-4 Function Calculations
- 2-5 List Calculations
- 2-6 Matrix and Vector Calculations
- 2-7 Using the Action Menu
- 2-8 Using the Interactive Menu
- 2-9 Using the Main Application in Combination with Other Applications
- 2-10 Using Verify
- Chapter 3 Using the Graph & Table Application
- Chapter 4 Using the Conics Application
- Chapter 5 Using the 3D Graph Application
- Chapter 6 Using the Sequence Application
- Chapter 7 Using the Statistics Application
- 7-1 Statistics Application Overview
- 7-2 Using List Editor
- 7-3 Before Trying to Draw a Statistical Graph
- 7-4 Graphing Single-Variable Statistical Data
- 7-5 Graphing Paired-Variable Statistical Data
- 7-6 Using the Statistical Graph Window Toolbar
- 7-7 Performing Statistical Calculations
- 7-8 Test, Confidence Interval, and Distribution Calculations
- 7-9 Tests
- 7-10 Confidence Intervals
- 7-11 Distribution
- 7-12 Statistical System Variables
- Chapter 8 Using the Geometry Application
- Chapter 9 Using the Numeric Solver Application
- Chapter 10 Using the eActivity Application
- Chapter 11 Using the Presentation Application
- Chapter 12 Using the Program Application
- Chapter 13 Using the Spreadsheet Application
- Chapter 14 Using the Setup Menu
- Chapter 15 Configuring System Settings
- 15-1 System Setting Overview
- 15-2 Managing Memory Usage
- 15-3 Using the Reset Dialog Box
- 15-4 Initializing Your ClassPad
- 15-5 Adjusting Display Contrast
- 15-6 Configuring Power Properties
- 15-7 Specifying the Display Language
- 15-8 Specifying the Font Set
- 15-9 Specifying the Alphabetic Keyboard Arrangement
- 15-10 Optimizing “Flash ROM”
- 15-11 Specifying the Ending Screen Image
- 15-12 Adjusting Touch Panel Alignment
- 15-13 Viewing Version Information
- Chapter 16 Performing Data Communication
- Appendix
20050501
7-11-3
Distribution
Definition of Terms
Lower : lower boundary
Upper : upper boundary
σ
: standard deviation (
σ
> 0)
µ
: mean
Input Example:
NormCD 0.5,0.8,1.23,0.56
Calculation Result Output
prob : normal distribution probability p
z
Low : standardized lower limit z value
z Up : standardized upper limit z value
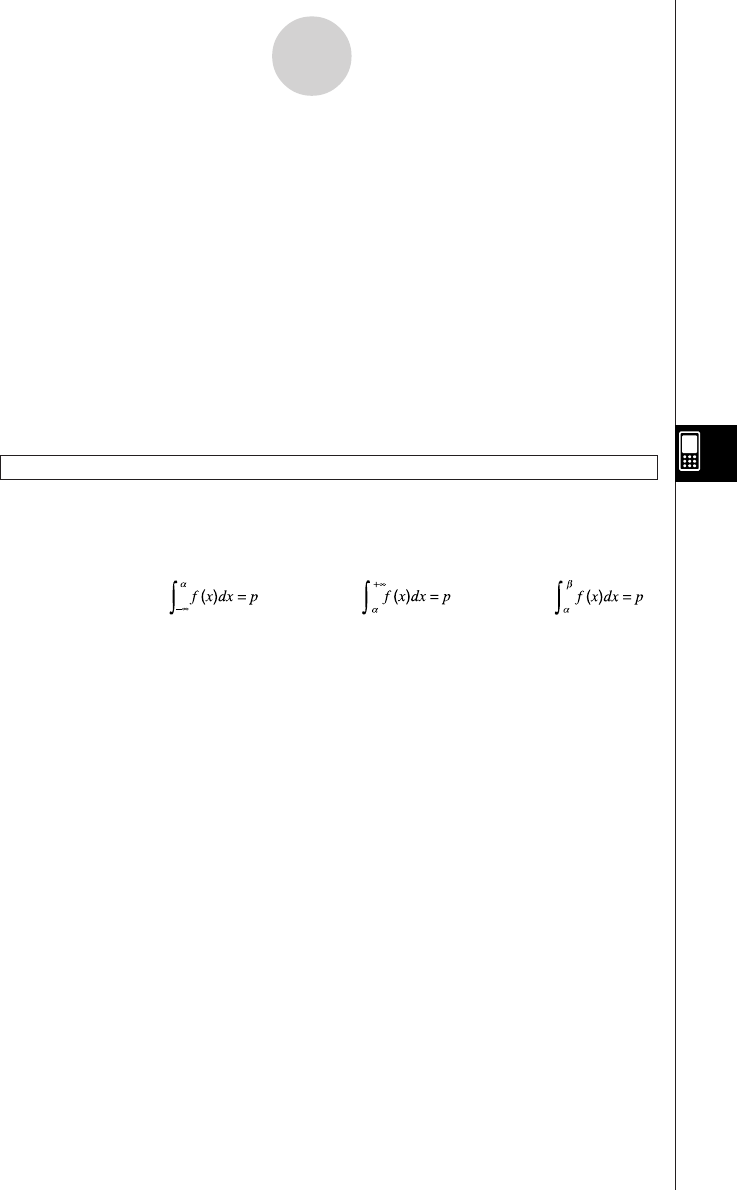
Inverse Cumulative Normal Distribution
Command: InvNorm 䡺
Description: This command calculates the cumulative probability in a normal distribution
based on lower and upper limits.
Tail:Left
Upper boundary of
integration interval
α = ?
Tail:Right
Lower boundary of
integration interval
α = ?
Tail:Central
Upper and lower boundaries
of integration interval
α = ? β = ?
Specify a probability and then use the above formulas to obtain the applicable
integration interval.
Command Syntax
“Tail setting”, Area value,
σ
value,
µ
value
Definition of Terms
Tail setting: probability value tail specification (L (Left), R (Right), C (Central))
Area : probability value (0 < Area < 1)
σ
: standard deviation (
σ
> 0)
µ
: mean
Input Example:
InvNorm “L”,0.35,1.2,0.3
20090801