
User Manual

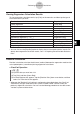
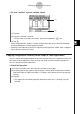
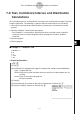
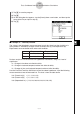
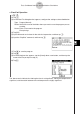
Table Of Contents
- Getting Ready
- Contents
- About This User’s Guide
- Chapter 1 Getting Acquainted
- Chapter 2 Using the Main Application
- 2-1 Main Application Overview
- 2-2 Basic Calculations
- 2-3 Using the Calculation History
- 2-4 Function Calculations
- 2-5 List Calculations
- 2-6 Matrix and Vector Calculations
- 2-7 Using the Action Menu
- 2-8 Using the Interactive Menu
- 2-9 Using the Main Application in Combination with Other Applications
- 2-10 Using Verify
- Chapter 3 Using the Graph & Table Application
- Chapter 4 Using the Conics Application
- Chapter 5 Using the 3D Graph Application
- Chapter 6 Using the Sequence Application
- Chapter 7 Using the Statistics Application
- 7-1 Statistics Application Overview
- 7-2 Using List Editor
- 7-3 Before Trying to Draw a Statistical Graph
- 7-4 Graphing Single-Variable Statistical Data
- 7-5 Graphing Paired-Variable Statistical Data
- 7-6 Using the Statistical Graph Window Toolbar
- 7-7 Performing Statistical Calculations
- 7-8 Test, Confidence Interval, and Distribution Calculations
- 7-9 Tests
- 7-10 Confidence Intervals
- 7-11 Distribution
- 7-12 Statistical System Variables
- Chapter 8 Using the Geometry Application
- Chapter 9 Using the Numeric Solver Application
- Chapter 10 Using the eActivity Application
- Chapter 11 Using the Presentation Application
- Chapter 12 Using the Program Application
- Chapter 13 Using the Spreadsheet Application
- Chapter 14 Using the Setup Menu
- Chapter 15 Configuring System Settings
- 15-1 System Setting Overview
- 15-2 Managing Memory Usage
- 15-3 Using the Reset Dialog Box
- 15-4 Initializing Your ClassPad
- 15-5 Adjusting Display Contrast
- 15-6 Configuring Power Properties
- 15-7 Specifying the Display Language
- 15-8 Specifying the Font Set
- 15-9 Specifying the Alphabetic Keyboard Arrangement
- 15-10 Optimizing “Flash ROM”
- 15-11 Specifying the Ending Screen Image
- 15-12 Adjusting Touch Panel Alignment
- 15-13 Viewing Version Information
- Chapter 16 Performing Data Communication
- Appendix
20050501
7-8 Test, Confidence Interval, and Distribution
Calculations
Test, confidence interval, and distribution calculations are all performed using the ClassPad’s
Program application. The following is a general overview of the steps that are involved.
1. Use statistical commands to build the necessary expressions and write them into the
program.
2. Write the “DispStat” command into the program.
• The “DispStat” is a command for displaying statistical calculation results. Statistical
calculation results cannot be displayed unless the program includes a “DispStat”
command.
3. Save the program.
4. Run the program.
k Example 1: 1-Sample ZTest
µ condition :
≠
µ0 : 0
σ : 3
o : 24.5
n : 48
u ClassPad Operation
(1) m p
(2) Tap O.
(3) On the New File dialog box that appears, configure the settings as described below.
Type: Program(Normal)
Folder: Select the name of the folder where you want to save the program you are
creating.
Name: Enter a file name for the program.
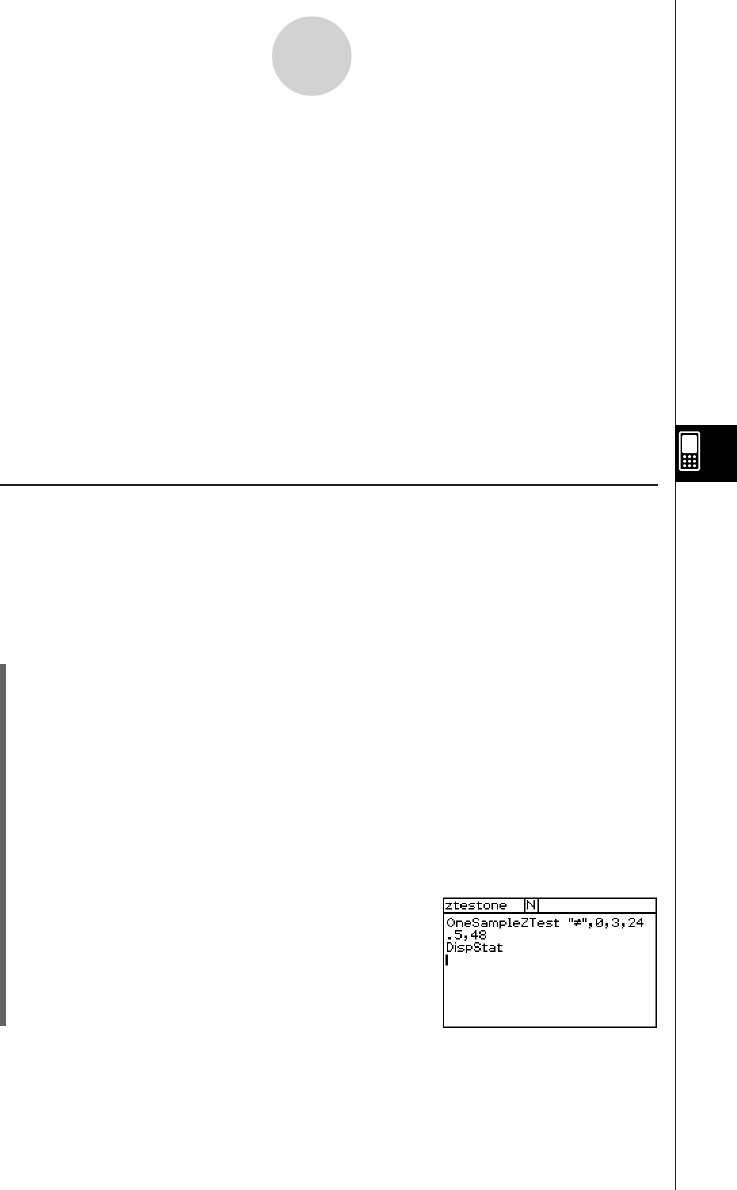
Example: ztestone
(4) Tap [OK].
(5) Input commands and values for the statistical expression, and then tap w.
(6) Input the “DispStat” command, and then tap w.
7-8-1
Test, Confidence Interval, and Distribution Calculations