
User Manual

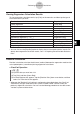
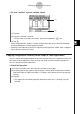
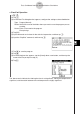
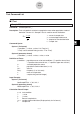
Table Of Contents
- Getting Ready
- Contents
- About This User’s Guide
- Chapter 1 Getting Acquainted
- Chapter 2 Using the Main Application
- 2-1 Main Application Overview
- 2-2 Basic Calculations
- 2-3 Using the Calculation History
- 2-4 Function Calculations
- 2-5 List Calculations
- 2-6 Matrix and Vector Calculations
- 2-7 Using the Action Menu
- 2-8 Using the Interactive Menu
- 2-9 Using the Main Application in Combination with Other Applications
- 2-10 Using Verify
- Chapter 3 Using the Graph & Table Application
- Chapter 4 Using the Conics Application
- Chapter 5 Using the 3D Graph Application
- Chapter 6 Using the Sequence Application
- Chapter 7 Using the Statistics Application
- 7-1 Statistics Application Overview
- 7-2 Using List Editor
- 7-3 Before Trying to Draw a Statistical Graph
- 7-4 Graphing Single-Variable Statistical Data
- 7-5 Graphing Paired-Variable Statistical Data
- 7-6 Using the Statistical Graph Window Toolbar
- 7-7 Performing Statistical Calculations
- 7-8 Test, Confidence Interval, and Distribution Calculations
- 7-9 Tests
- 7-10 Confidence Intervals
- 7-11 Distribution
- 7-12 Statistical System Variables
- Chapter 8 Using the Geometry Application
- Chapter 9 Using the Numeric Solver Application
- Chapter 10 Using the eActivity Application
- Chapter 11 Using the Presentation Application
- Chapter 12 Using the Program Application
- Chapter 13 Using the Spreadsheet Application
- Chapter 14 Using the Setup Menu
- Chapter 15 Configuring System Settings
- 15-1 System Setting Overview
- 15-2 Managing Memory Usage
- 15-3 Using the Reset Dialog Box
- 15-4 Initializing Your ClassPad
- 15-5 Adjusting Display Contrast
- 15-6 Configuring Power Properties
- 15-7 Specifying the Display Language
- 15-8 Specifying the Font Set
- 15-9 Specifying the Alphabetic Keyboard Arrangement
- 15-10 Optimizing “Flash ROM”
- 15-11 Specifying the Ending Screen Image
- 15-12 Adjusting Touch Panel Alignment
- 15-13 Viewing Version Information
- Chapter 16 Performing Data Communication
- Appendix
20050501
Viewing Paired-variable Statistical Calculation Results
Besides using a graph, you can also use the following procedure to view the paired-variable
statistics parameter values.
u To display paired-variable calculation results
(1) On the menu bar, tap [Calc] and then [Two-Variable].
(2) On the dialog box that appears, specify the [XList] name and [YList] name, and select
the [Freq] setting (page 7-3-3, 7-3-4).
(3) Tap [OK].
7-7-2
Performing Statistical Calculations
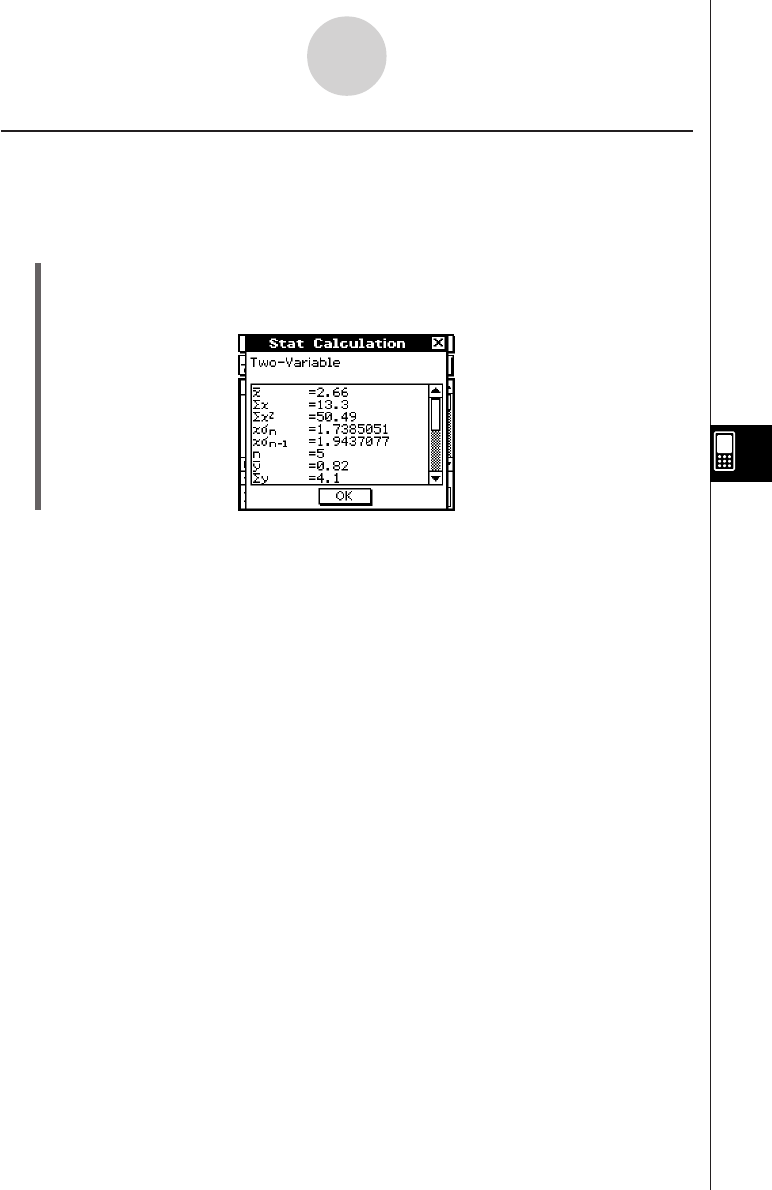
•This displays the Stat Calculation dialog box with the paired-variable statistical calculation
results described below. You can use the scrollbar to scroll the results.
o :mean of XList data
Σx : sum of XList data
Σx
2
: sum of squares of XList data
xσn : population standard deviation of XList data
xσn–1 : sample standard deviation of XList data
n : sample size
p :mean of YList data
Σy : sum of YList data
Σy
2
: sum of squares of YList data
yσn : population standard deviation of YList data
yσn–1 : sample standard deviation of YList data
Σxy : sum of products of XList and YList data
minX : minimum of XList data
maxX : maximum of XList data
minY : minimum of YList data
maxY : maximum of YList data