
User Manual
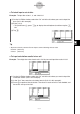
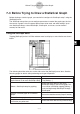
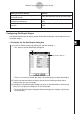
Table Of Contents
- Getting Ready
- Contents
- About This User’s Guide
- Chapter 1 Getting Acquainted
- Chapter 2 Using the Main Application
- 2-1 Main Application Overview
- 2-2 Basic Calculations
- 2-3 Using the Calculation History
- 2-4 Function Calculations
- 2-5 List Calculations
- 2-6 Matrix and Vector Calculations
- 2-7 Using the Action Menu
- 2-8 Using the Interactive Menu
- 2-9 Using the Main Application in Combination with Other Applications
- 2-10 Using Verify
- Chapter 3 Using the Graph & Table Application
- Chapter 4 Using the Conics Application
- Chapter 5 Using the 3D Graph Application
- Chapter 6 Using the Sequence Application
- Chapter 7 Using the Statistics Application
- 7-1 Statistics Application Overview
- 7-2 Using List Editor
- 7-3 Before Trying to Draw a Statistical Graph
- 7-4 Graphing Single-Variable Statistical Data
- 7-5 Graphing Paired-Variable Statistical Data
- 7-6 Using the Statistical Graph Window Toolbar
- 7-7 Performing Statistical Calculations
- 7-8 Test, Confidence Interval, and Distribution Calculations
- 7-9 Tests
- 7-10 Confidence Intervals
- 7-11 Distribution
- 7-12 Statistical System Variables
- Chapter 8 Using the Geometry Application
- Chapter 9 Using the Numeric Solver Application
- Chapter 10 Using the eActivity Application
- Chapter 11 Using the Presentation Application
- Chapter 12 Using the Program Application
- Chapter 13 Using the Spreadsheet Application
- Chapter 14 Using the Setup Menu
- Chapter 15 Configuring System Settings
- 15-1 System Setting Overview
- 15-2 Managing Memory Usage
- 15-3 Using the Reset Dialog Box
- 15-4 Initializing Your ClassPad
- 15-5 Adjusting Display Contrast
- 15-6 Configuring Power Properties
- 15-7 Specifying the Display Language
- 15-8 Specifying the Font Set
- 15-9 Specifying the Alphabetic Keyboard Arrangement
- 15-10 Optimizing “Flash ROM”
- 15-11 Specifying the Ending Screen Image
- 15-12 Adjusting Touch Panel Alignment
- 15-13 Viewing Version Information
- Chapter 16 Performing Data Communication
- Appendix
20050501
7-3 Before Trying to Draw a Statistical Graph
Before drawing a statistical graph, you need to first configure its “StatGraph setup” using the
[SetGraph] menu.
The StatGraph setup allows you to configure parameters to control the graph type, the lists
that contain a graph’s data, the type of plot markers to be used, and other settings. Up to
nine StatGraph setups, named StatGraph1, StatGraph2, and so on, can be stored in
memory for later recall.
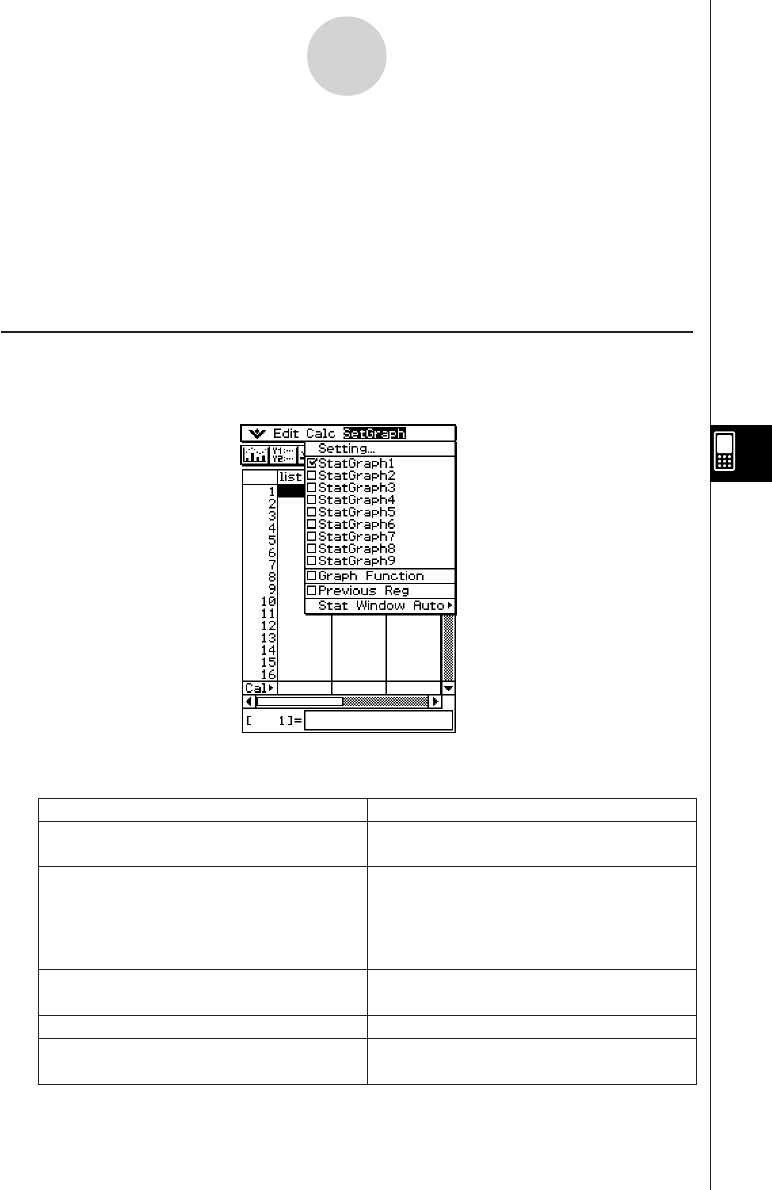
Using the SetGraph Menu
Tapping [SetGraph] on the List Editor window menu bar displays a menu like the one shown
below.
7-3-1
Before Trying to Draw a Statistical Graph
The following describes what you can do with each of the [SetGraph] menu items. See the
following pages for details about performing each type of operation.
Do this:When you want to do this:
Display a dialog box for specifying the graph
type and data list for each StatGraph setup
Tap [Setting…].
Select a StatGraph setup for graphing
Select the check box(es) next to the
StatGraph setup(s) you want to graph. This
can also be achieved by tapping [Setting...]
and scrolling through StatGraph1 through
StatGraph9.
Overlay a function graph on a statistical
graph
Select the check box next to [Graph Function].
Tu rn off function graph overlay
Clear the check box next to [Graph Function].
Graph the results of the last regression
calculation you performed
Select the check box next to [Previous Reg].