
User Manual
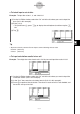
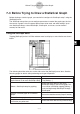
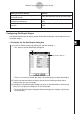
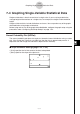
Table Of Contents
- Getting Ready
- Contents
- About This User’s Guide
- Chapter 1 Getting Acquainted
- Chapter 2 Using the Main Application
- 2-1 Main Application Overview
- 2-2 Basic Calculations
- 2-3 Using the Calculation History
- 2-4 Function Calculations
- 2-5 List Calculations
- 2-6 Matrix and Vector Calculations
- 2-7 Using the Action Menu
- 2-8 Using the Interactive Menu
- 2-9 Using the Main Application in Combination with Other Applications
- 2-10 Using Verify
- Chapter 3 Using the Graph & Table Application
- Chapter 4 Using the Conics Application
- Chapter 5 Using the 3D Graph Application
- Chapter 6 Using the Sequence Application
- Chapter 7 Using the Statistics Application
- 7-1 Statistics Application Overview
- 7-2 Using List Editor
- 7-3 Before Trying to Draw a Statistical Graph
- 7-4 Graphing Single-Variable Statistical Data
- 7-5 Graphing Paired-Variable Statistical Data
- 7-6 Using the Statistical Graph Window Toolbar
- 7-7 Performing Statistical Calculations
- 7-8 Test, Confidence Interval, and Distribution Calculations
- 7-9 Tests
- 7-10 Confidence Intervals
- 7-11 Distribution
- 7-12 Statistical System Variables
- Chapter 8 Using the Geometry Application
- Chapter 9 Using the Numeric Solver Application
- Chapter 10 Using the eActivity Application
- Chapter 11 Using the Presentation Application
- Chapter 12 Using the Program Application
- Chapter 13 Using the Spreadsheet Application
- Chapter 14 Using the Setup Menu
- Chapter 15 Configuring System Settings
- 15-1 System Setting Overview
- 15-2 Managing Memory Usage
- 15-3 Using the Reset Dialog Box
- 15-4 Initializing Your ClassPad
- 15-5 Adjusting Display Contrast
- 15-6 Configuring Power Properties
- 15-7 Specifying the Display Language
- 15-8 Specifying the Font Set
- 15-9 Specifying the Alphabetic Keyboard Arrangement
- 15-10 Optimizing “Flash ROM”
- 15-11 Specifying the Ending Screen Image
- 15-12 Adjusting Touch Panel Alignment
- 15-13 Viewing Version Information
- Chapter 16 Performing Data Communication
- Appendix

20050501
Controlling the Number of Displayed List Columns
You can use the following procedures to control how many list columns appear on the
Statistics application window. You can select 2, 3, or 4 columns.
u To specify the number of columns for the list display
On the List Editor window, tap S (two columns), D (three columns) or F (four columns)
to specify the width. You will need to tap the arrow button on the right end of the toolbar to
see the icons.
Tip
•You can also specify the number of display cells using the [Cell Width Pattern] setting on the
[Cell] tab of the Basic Format dialog box (page 14-3-3).
• When you have the List Editor window displayed along with a second window, you can make the
List Editor window active and then tap the r button on the icon panel to expand the List Editor
window to fill the entire display. For more information, see “Using a Dual Window Display” on
page 1-5-1.
Clearing All List Editor Data
Use the following procedure to initialize the List Editor and clear all currently displayed data.
Following this procedure, the List Editor shows six empty lists, named list1 through list6.
Warning!
•Performing the following procedure clears all the data from List Editor window list1 through
list6.
u To clear all list editor data
(1) On the List Editor window, tap [Edit] and then [Clear All].
(2) On the confirmation dialog box that appears, tap [OK] to clear the all list data or
[Cancel] to cancel the clear operation.
•After you tap [OK], the List Editor window shows six empty lists (three lists visible on
the ClassPad display at a time), named list1 through list6.
7-2-9
Using List Editor