
User Manual
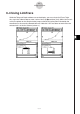
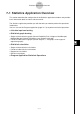
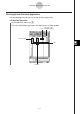
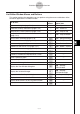


Table Of Contents
- Getting Ready
- Contents
- About This User’s Guide
- Chapter 1 Getting Acquainted
- Chapter 2 Using the Main Application
- 2-1 Main Application Overview
- 2-2 Basic Calculations
- 2-3 Using the Calculation History
- 2-4 Function Calculations
- 2-5 List Calculations
- 2-6 Matrix and Vector Calculations
- 2-7 Using the Action Menu
- 2-8 Using the Interactive Menu
- 2-9 Using the Main Application in Combination with Other Applications
- 2-10 Using Verify
- Chapter 3 Using the Graph & Table Application
- Chapter 4 Using the Conics Application
- Chapter 5 Using the 3D Graph Application
- Chapter 6 Using the Sequence Application
- Chapter 7 Using the Statistics Application
- 7-1 Statistics Application Overview
- 7-2 Using List Editor
- 7-3 Before Trying to Draw a Statistical Graph
- 7-4 Graphing Single-Variable Statistical Data
- 7-5 Graphing Paired-Variable Statistical Data
- 7-6 Using the Statistical Graph Window Toolbar
- 7-7 Performing Statistical Calculations
- 7-8 Test, Confidence Interval, and Distribution Calculations
- 7-9 Tests
- 7-10 Confidence Intervals
- 7-11 Distribution
- 7-12 Statistical System Variables
- Chapter 8 Using the Geometry Application
- Chapter 9 Using the Numeric Solver Application
- Chapter 10 Using the eActivity Application
- Chapter 11 Using the Presentation Application
- Chapter 12 Using the Program Application
- Chapter 13 Using the Spreadsheet Application
- Chapter 14 Using the Setup Menu
- Chapter 15 Configuring System Settings
- 15-1 System Setting Overview
- 15-2 Managing Memory Usage
- 15-3 Using the Reset Dialog Box
- 15-4 Initializing Your ClassPad
- 15-5 Adjusting Display Contrast
- 15-6 Configuring Power Properties
- 15-7 Specifying the Display Language
- 15-8 Specifying the Font Set
- 15-9 Specifying the Alphabetic Keyboard Arrangement
- 15-10 Optimizing “Flash ROM”
- 15-11 Specifying the Ending Screen Image
- 15-12 Adjusting Touch Panel Alignment
- 15-13 Viewing Version Information
- Chapter 16 Performing Data Communication
- Appendix
20050501
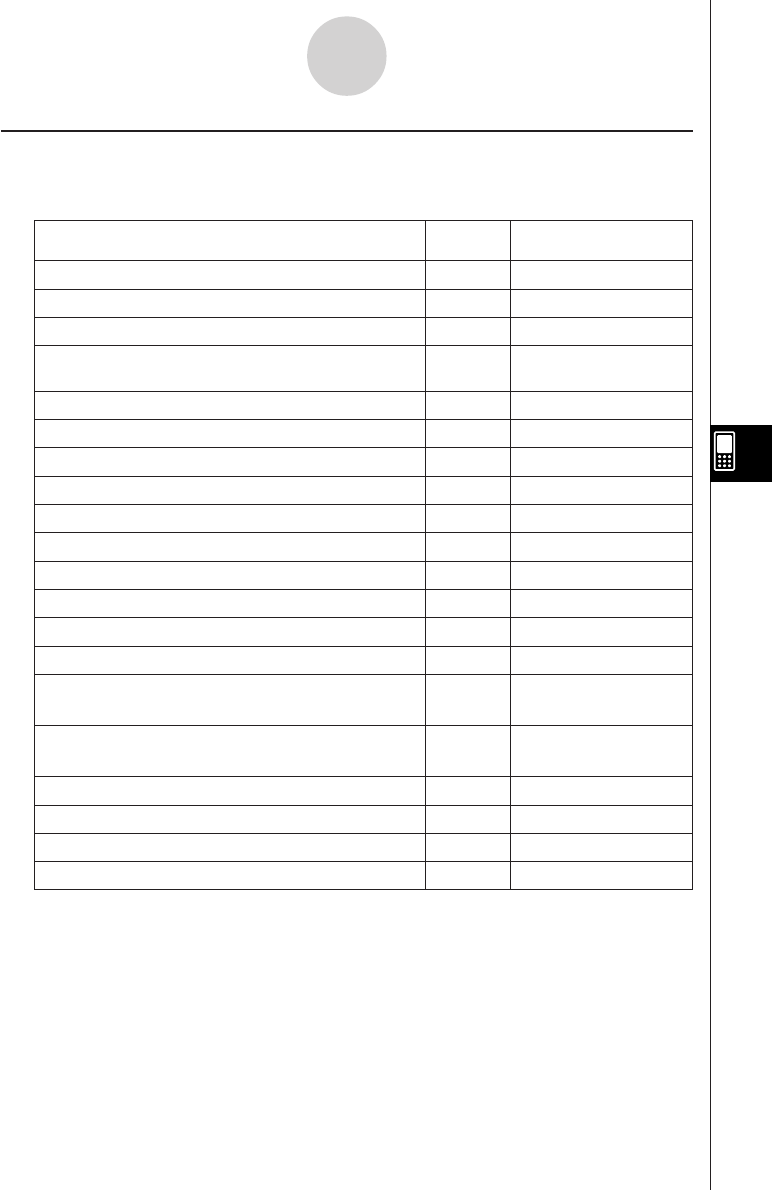
List Editor Window Menus and Buttons
This section explains the operations you can perform using the menus and buttons of the
Statistical application’s List Editor window.
7-1-3
Statistics Application Overview
To do this:
Tap this
button:
Or select this
menu item:
—
Open an existing list (page 7-2-3)
Edit - Open List
—
Close the currently selected list (page 7-2-4)
Edit - Close List
—
Jump to line 1 of the current list (page 7-2-3)
Edit - Jump to Top
—
Jump to the line after the last line of the current list
(page 7-2-3)
Edit - Jump to Bottom
L
Sort list data ascending (page 7-2-8)
Edit - Sort(Ascending)
:
Sort list data descending (page 7-2-8)
Edit - Sort(Descending)
H
Delete a cell (page 7-2-7)
Edit - Delete - Cell
J
Delete all of the data in a list (page 7-2-7)
Edit - Delete - Column
—
Delete a list from memory (page 7-2-7)
Edit - Delete - List Variable
K
Insert a cell into a list (page 7-2-7)
Edit - Insert Cell
O - Settings -
View Window
O - Settings -
Variable Manager
9
Convert a mathematical expression to a value
—
—
—
—
y
Draw a statistical graph
!
Display Graph Editor window
~
Display the Main application work area window
6
Display the View Window dialog box
5
Display the Variable Manager
SetGraph - Setting…
G
Display the Set StatGraphs dialog box
—
S
Display two columns in the List Editor window
—
D
Display three columns in the List Editor window
—
F
Display four columns in the List Editor window