
User Manual
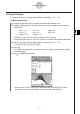
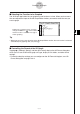
Table Of Contents
- Getting Ready
- Contents
- About This User’s Guide
- Chapter 1 Getting Acquainted
- Chapter 2 Using the Main Application
- 2-1 Main Application Overview
- 2-2 Basic Calculations
- 2-3 Using the Calculation History
- 2-4 Function Calculations
- 2-5 List Calculations
- 2-6 Matrix and Vector Calculations
- 2-7 Using the Action Menu
- 2-8 Using the Interactive Menu
- 2-9 Using the Main Application in Combination with Other Applications
- 2-10 Using Verify
- Chapter 3 Using the Graph & Table Application
- Chapter 4 Using the Conics Application
- Chapter 5 Using the 3D Graph Application
- Chapter 6 Using the Sequence Application
- Chapter 7 Using the Statistics Application
- 7-1 Statistics Application Overview
- 7-2 Using List Editor
- 7-3 Before Trying to Draw a Statistical Graph
- 7-4 Graphing Single-Variable Statistical Data
- 7-5 Graphing Paired-Variable Statistical Data
- 7-6 Using the Statistical Graph Window Toolbar
- 7-7 Performing Statistical Calculations
- 7-8 Test, Confidence Interval, and Distribution Calculations
- 7-9 Tests
- 7-10 Confidence Intervals
- 7-11 Distribution
- 7-12 Statistical System Variables
- Chapter 8 Using the Geometry Application
- Chapter 9 Using the Numeric Solver Application
- Chapter 10 Using the eActivity Application
- Chapter 11 Using the Presentation Application
- Chapter 12 Using the Program Application
- Chapter 13 Using the Spreadsheet Application
- Chapter 14 Using the Setup Menu
- Chapter 15 Configuring System Settings
- 15-1 System Setting Overview
- 15-2 Managing Memory Usage
- 15-3 Using the Reset Dialog Box
- 15-4 Initializing Your ClassPad
- 15-5 Adjusting Display Contrast
- 15-6 Configuring Power Properties
- 15-7 Specifying the Display Language
- 15-8 Specifying the Font Set
- 15-9 Specifying the Alphabetic Keyboard Arrangement
- 15-10 Optimizing “Flash ROM”
- 15-11 Specifying the Ending Screen Image
- 15-12 Adjusting Touch Panel Alignment
- 15-13 Viewing Version Information
- Chapter 16 Performing Data Communication
- Appendix
20050501
5-4-1
Manipulating a Graph on the 3D Graph Window
5-4 Manipulating a Graph on the 3D Graph
Window
This section describes how to enlarge and reduce the size of a graph, how to change the
eye position to view the graph along a particular axis, and how to perform other operations
like automatic rotation.
Important!
•All of the operations described in this section can be performed only while the 3D Graph
window is active.
Enlarging and Reducing the Size of a Graph
A displayed 3D graph can be zoomed so it is enlarged or reduced. The zoom operation is
always performed based on the center of the Graph window. You cannot select the area to
be zoomed.
• To enlarge a graph, tap W, or tap [Zoom] and then [Zoom In].
• To reduce the size of a graph, tap E, or tap [Zoom] and then [Zoom Out].
Starting from the normal size, you can enlarge a graph six steps or reduce its size eight
steps.
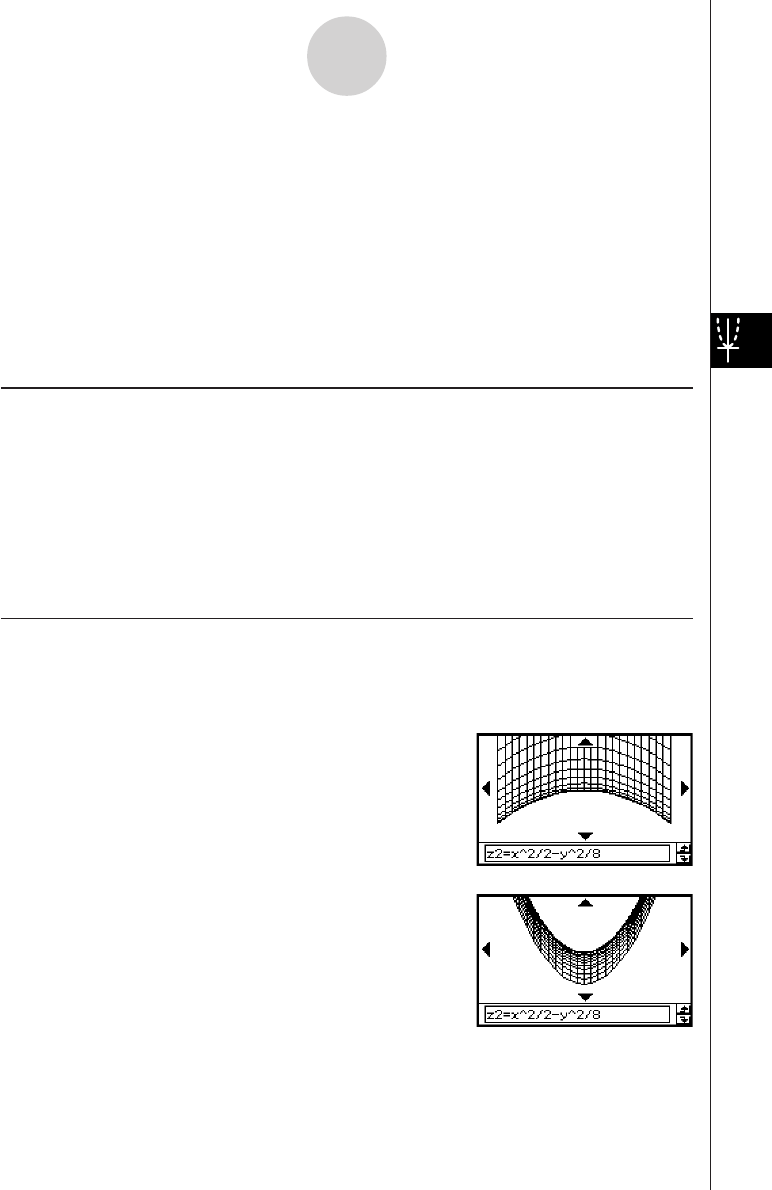
Switching the Eye Position
The following items describe how to change the eye position and view a displayed 3D graph
along a particular axis. All of the example displays below show the graph of the expression
z = x
2
/2 – y
2
/8, which we graphed under “3D Graph Example” on page 5-3-3.
• To view the graph facing the x-axis, tap [Zoom] and then
[View-x], or press the x key.
• To view the graph facing the y-axis, tap [Zoom] and then
[View-y], or press the y key.