
User Manual
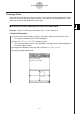
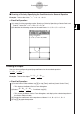
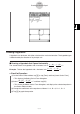
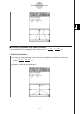
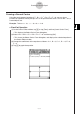
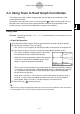
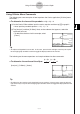
Table Of Contents
- Getting Ready
- Contents
- About This User’s Guide
- Chapter 1 Getting Acquainted
- Chapter 2 Using the Main Application
- 2-1 Main Application Overview
- 2-2 Basic Calculations
- 2-3 Using the Calculation History
- 2-4 Function Calculations
- 2-5 List Calculations
- 2-6 Matrix and Vector Calculations
- 2-7 Using the Action Menu
- 2-8 Using the Interactive Menu
- 2-9 Using the Main Application in Combination with Other Applications
- 2-10 Using Verify
- Chapter 3 Using the Graph & Table Application
- Chapter 4 Using the Conics Application
- Chapter 5 Using the 3D Graph Application
- Chapter 6 Using the Sequence Application
- Chapter 7 Using the Statistics Application
- 7-1 Statistics Application Overview
- 7-2 Using List Editor
- 7-3 Before Trying to Draw a Statistical Graph
- 7-4 Graphing Single-Variable Statistical Data
- 7-5 Graphing Paired-Variable Statistical Data
- 7-6 Using the Statistical Graph Window Toolbar
- 7-7 Performing Statistical Calculations
- 7-8 Test, Confidence Interval, and Distribution Calculations
- 7-9 Tests
- 7-10 Confidence Intervals
- 7-11 Distribution
- 7-12 Statistical System Variables
- Chapter 8 Using the Geometry Application
- Chapter 9 Using the Numeric Solver Application
- Chapter 10 Using the eActivity Application
- Chapter 11 Using the Presentation Application
- Chapter 12 Using the Program Application
- Chapter 13 Using the Spreadsheet Application
- Chapter 14 Using the Setup Menu
- Chapter 15 Configuring System Settings
- 15-1 System Setting Overview
- 15-2 Managing Memory Usage
- 15-3 Using the Reset Dialog Box
- 15-4 Initializing Your ClassPad
- 15-5 Adjusting Display Contrast
- 15-6 Configuring Power Properties
- 15-7 Specifying the Display Language
- 15-8 Specifying the Font Set
- 15-9 Specifying the Alphabetic Keyboard Arrangement
- 15-10 Optimizing “Flash ROM”
- 15-11 Specifying the Ending Screen Image
- 15-12 Adjusting Touch Panel Alignment
- 15-13 Viewing Version Information
- Chapter 16 Performing Data Communication
- Appendix
20050501
4-4-1
Using Trace to Read Graph Coordinates
4-4 Using Trace to Read Graph Coordinates
Trace allows you move a pointer along a graph line and display the coordinates at the
current pointer location.
Starting the trace operation causes a crosshair pointer ( ) to appear on the graph. You can
then press the cursor key or tap the graph controller arrows to move the pointer to the
location you want, and read the coordinates that appear on the display.
Using Trace
Example: To graph the function x = 2(y – 1)
2
– 2 and then perform a trace operation to read
coordinates
u ClassPad Operation
(1) On the Conics Editor window, input the above equation and then tap ^ to graph it.
(2) Tap [Analysis] and then [Trace], or tap =.
• This causes “Trace” to appear on the Graph window, with a pointer on the graph line.
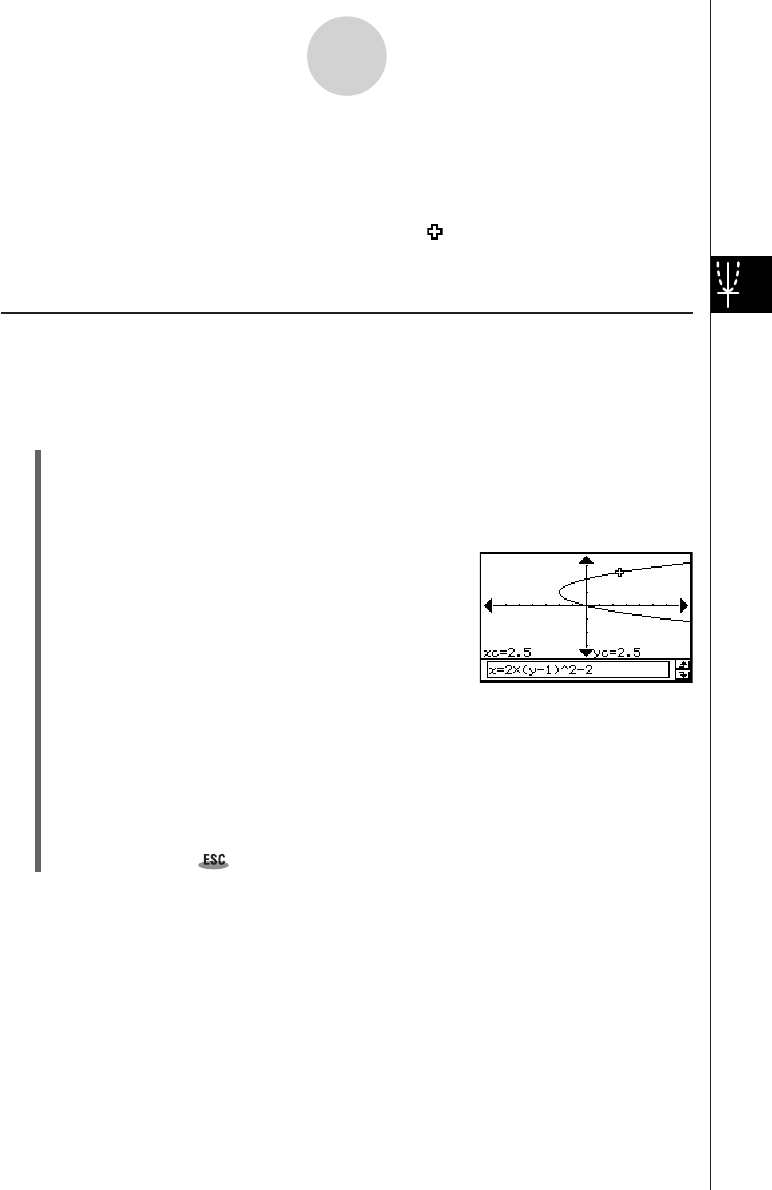
(3) Press the left or right cursor key, or tap the left or right graph controller arrows.
• This moves the pointer along the graph, and displays
the coordinates of the current pointer location.
•When the location of the pointer approaches the point
of infinity on a parabolic or hyperbolic graph, “Error”
appears in place of the pointer coordinates.
•You can also move the pointer to a particular point by inputting coordinates. Inputting
a value while a trace operation is being performed displays a dialog box for inputting
an x-coordinate. After you enter a value, the pointer jumps to the corresponding
location when you tap [OK].
Here, input a value for yc in the case of a parabola that opens horizontally. Input a
value for xc in the case of a parabola that opens vertically. For any other type of
conics graph, input a value for tc in order to graph in parametric format.
(4) To exit trace, tap on the icon panel.
Tip
• While tracing, tapping the displayed coordinate values causes the coordinate values to appear in
the message box. You can then copy the coordinates to the clipboard.