
User Manual
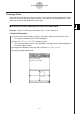
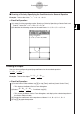
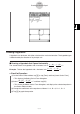
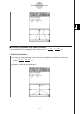
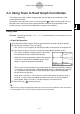
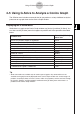
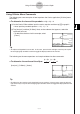
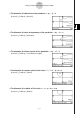
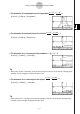
Table Of Contents
- Getting Ready
- Contents
- About This User’s Guide
- Chapter 1 Getting Acquainted
- Chapter 2 Using the Main Application
- 2-1 Main Application Overview
- 2-2 Basic Calculations
- 2-3 Using the Calculation History
- 2-4 Function Calculations
- 2-5 List Calculations
- 2-6 Matrix and Vector Calculations
- 2-7 Using the Action Menu
- 2-8 Using the Interactive Menu
- 2-9 Using the Main Application in Combination with Other Applications
- 2-10 Using Verify
- Chapter 3 Using the Graph & Table Application
- Chapter 4 Using the Conics Application
- Chapter 5 Using the 3D Graph Application
- Chapter 6 Using the Sequence Application
- Chapter 7 Using the Statistics Application
- 7-1 Statistics Application Overview
- 7-2 Using List Editor
- 7-3 Before Trying to Draw a Statistical Graph
- 7-4 Graphing Single-Variable Statistical Data
- 7-5 Graphing Paired-Variable Statistical Data
- 7-6 Using the Statistical Graph Window Toolbar
- 7-7 Performing Statistical Calculations
- 7-8 Test, Confidence Interval, and Distribution Calculations
- 7-9 Tests
- 7-10 Confidence Intervals
- 7-11 Distribution
- 7-12 Statistical System Variables
- Chapter 8 Using the Geometry Application
- Chapter 9 Using the Numeric Solver Application
- Chapter 10 Using the eActivity Application
- Chapter 11 Using the Presentation Application
- Chapter 12 Using the Program Application
- Chapter 13 Using the Spreadsheet Application
- Chapter 14 Using the Setup Menu
- Chapter 15 Configuring System Settings
- 15-1 System Setting Overview
- 15-2 Managing Memory Usage
- 15-3 Using the Reset Dialog Box
- 15-4 Initializing Your ClassPad
- 15-5 Adjusting Display Contrast
- 15-6 Configuring Power Properties
- 15-7 Specifying the Display Language
- 15-8 Specifying the Font Set
- 15-9 Specifying the Alphabetic Keyboard Arrangement
- 15-10 Optimizing “Flash ROM”
- 15-11 Specifying the Ending Screen Image
- 15-12 Adjusting Touch Panel Alignment
- 15-13 Viewing Version Information
- Chapter 16 Performing Data Communication
- Appendix

20050501
k Drawing a Circle by Specifying the Coefficients of a General Equation
Example: To draw the circle x
2
+ y
2
+ 4x – 6y + 9 = 0
u ClassPad Operation
(1) In step (2) of the procedure under “Drawing a Circle by Specifying a Center Point and
Radius”, select “AX
2
+ AY
2
+ BX + CY + D = 0”.
(2) Substitute the following values for the coefficients: A = 1, B = 4, C = –6, D = 9.
4-3-5
Drawing a Conics Graph
Drawing an Ellipse
You can draw an ellipse by specifying coefficients for the standard equation:
Example: To draw the ellipse
u ClassPad Operation
(1) On the Conics Editor window, tap q, or tap [Form] and then [Insert Conics Form].
• This displays the Select Conics Form dialog box.
(2) Select “ ” and then tap [OK].
• This closes the Select Conics Form dialog box, and displays the selected equation in
the Conics Editor window.
(3) Change the coefficients of the equation as follows: A = 2, B = 3, H = 1, K = 2.
(4) Tap ^ to graph the equation.
(x – H)
2
+
(y – K)
2
= 1.
A
2
B
2
(x – 1)
2
+
(y – 2)
2
= 1
2
2
3
2
(X – H)
2
+
(Y – K)
2
= 1
A
2
B
2