
User Manual
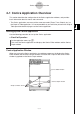
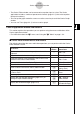
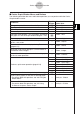
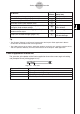

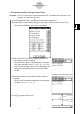
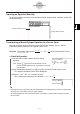
Table Of Contents
- Getting Ready
- Contents
- About This User’s Guide
- Chapter 1 Getting Acquainted
- Chapter 2 Using the Main Application
- 2-1 Main Application Overview
- 2-2 Basic Calculations
- 2-3 Using the Calculation History
- 2-4 Function Calculations
- 2-5 List Calculations
- 2-6 Matrix and Vector Calculations
- 2-7 Using the Action Menu
- 2-8 Using the Interactive Menu
- 2-9 Using the Main Application in Combination with Other Applications
- 2-10 Using Verify
- Chapter 3 Using the Graph & Table Application
- Chapter 4 Using the Conics Application
- Chapter 5 Using the 3D Graph Application
- Chapter 6 Using the Sequence Application
- Chapter 7 Using the Statistics Application
- 7-1 Statistics Application Overview
- 7-2 Using List Editor
- 7-3 Before Trying to Draw a Statistical Graph
- 7-4 Graphing Single-Variable Statistical Data
- 7-5 Graphing Paired-Variable Statistical Data
- 7-6 Using the Statistical Graph Window Toolbar
- 7-7 Performing Statistical Calculations
- 7-8 Test, Confidence Interval, and Distribution Calculations
- 7-9 Tests
- 7-10 Confidence Intervals
- 7-11 Distribution
- 7-12 Statistical System Variables
- Chapter 8 Using the Geometry Application
- Chapter 9 Using the Numeric Solver Application
- Chapter 10 Using the eActivity Application
- Chapter 11 Using the Presentation Application
- Chapter 12 Using the Program Application
- Chapter 13 Using the Spreadsheet Application
- Chapter 14 Using the Setup Menu
- Chapter 15 Configuring System Settings
- 15-1 System Setting Overview
- 15-2 Managing Memory Usage
- 15-3 Using the Reset Dialog Box
- 15-4 Initializing Your ClassPad
- 15-5 Adjusting Display Contrast
- 15-6 Configuring Power Properties
- 15-7 Specifying the Display Language
- 15-8 Specifying the Font Set
- 15-9 Specifying the Alphabetic Keyboard Arrangement
- 15-10 Optimizing “Flash ROM”
- 15-11 Specifying the Ending Screen Image
- 15-12 Adjusting Touch Panel Alignment
- 15-13 Viewing Version Information
- Chapter 16 Performing Data Communication
- Appendix
20050501
4-2-1
Inputting Equations
4-2 Inputting Equations
This section explains the various ways you can input equations using the Conics Editor
window.
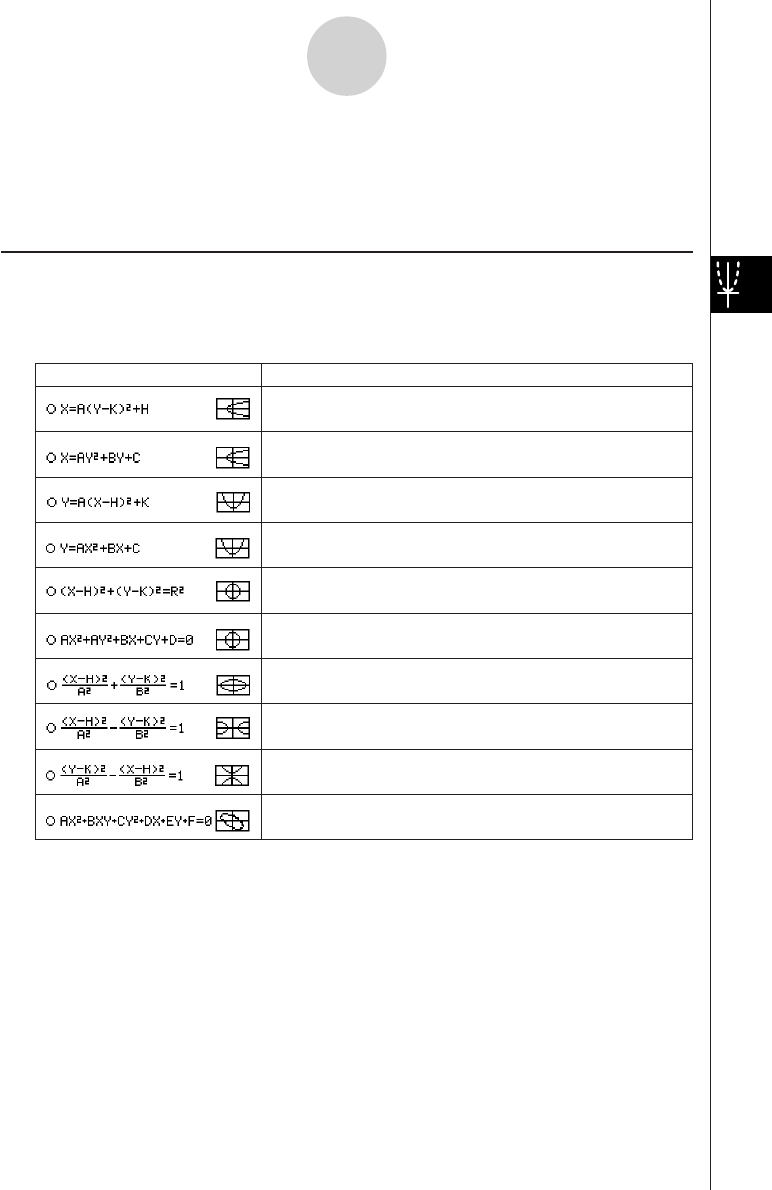
Using a Conics Form to Input an Equation
Preset formats can help you input conics equations quickly and easily. The following table
contains a complete list of the types of equations that you can input just by tapping [Form]
and then [Insert Conics Form].
Equations
Horizontal Parabola 1
x
=
A
·
(
y
–
K
)^2 +
H
Horizontal Parabola 2
x
=
A
·
y
^2 +
B
·
y
+
C
Vertical Parabola 1
y
=
A
·
(
x
–
H
)^2 +
K
Vertical Parabola 2
y
=
A
·
x
^2 +
B
·
x
+
C
Circle 1
(
x
–
H
)^2 + (
y
–
K
)^2 =
R
^2
Circle 2
A
·
x
^2 +
A
·
y
^2 +
B
·
x
+
C
·
y
+
D
= 0
Ellipse
(
x
–
H
)^2 ÷
A
^2 + (
y
–
K
)^2 ÷
B
^2 = 1
Horizontal Hyperbola
(
x
–
H
)^2 ÷
A
^2 – (
y
–
K
)^2 ÷
B
^2 = 1
Vertical Hyperbola
(
y
–
K
)^2 ÷
A
^2 – (
x
–
H
)^2 ÷
B
^2 = 1
General Form
A
·
x
^2 +
B
·
x
·
y
+
C
·
y
^2 +
D
·
x
+
E
·
y
+
F
= 0
Conics Forms