
User Manual
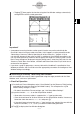

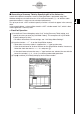
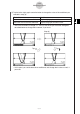

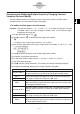

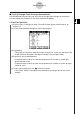
Table Of Contents
- Getting Ready
- Contents
- About This User’s Guide
- Chapter 1 Getting Acquainted
- Chapter 2 Using the Main Application
- 2-1 Main Application Overview
- 2-2 Basic Calculations
- 2-3 Using the Calculation History
- 2-4 Function Calculations
- 2-5 List Calculations
- 2-6 Matrix and Vector Calculations
- 2-7 Using the Action Menu
- 2-8 Using the Interactive Menu
- 2-9 Using the Main Application in Combination with Other Applications
- 2-10 Using Verify
- Chapter 3 Using the Graph & Table Application
- Chapter 4 Using the Conics Application
- Chapter 5 Using the 3D Graph Application
- Chapter 6 Using the Sequence Application
- Chapter 7 Using the Statistics Application
- 7-1 Statistics Application Overview
- 7-2 Using List Editor
- 7-3 Before Trying to Draw a Statistical Graph
- 7-4 Graphing Single-Variable Statistical Data
- 7-5 Graphing Paired-Variable Statistical Data
- 7-6 Using the Statistical Graph Window Toolbar
- 7-7 Performing Statistical Calculations
- 7-8 Test, Confidence Interval, and Distribution Calculations
- 7-9 Tests
- 7-10 Confidence Intervals
- 7-11 Distribution
- 7-12 Statistical System Variables
- Chapter 8 Using the Geometry Application
- Chapter 9 Using the Numeric Solver Application
- Chapter 10 Using the eActivity Application
- Chapter 11 Using the Presentation Application
- Chapter 12 Using the Program Application
- Chapter 13 Using the Spreadsheet Application
- Chapter 14 Using the Setup Menu
- Chapter 15 Configuring System Settings
- 15-1 System Setting Overview
- 15-2 Managing Memory Usage
- 15-3 Using the Reset Dialog Box
- 15-4 Initializing Your ClassPad
- 15-5 Adjusting Display Contrast
- 15-6 Configuring Power Properties
- 15-7 Specifying the Display Language
- 15-8 Specifying the Font Set
- 15-9 Specifying the Alphabetic Keyboard Arrangement
- 15-10 Optimizing “Flash ROM”
- 15-11 Specifying the Ending Screen Image
- 15-12 Adjusting Touch Panel Alignment
- 15-13 Viewing Version Information
- Chapter 16 Performing Data Communication
- Appendix
20050501
Simultaneously Modifying Multiple Graphs by Changing Common
Variables (Dynamic Modify)
Use the procedure below to change the values of up to two common variables used in
multiple functions to simultaneously modify the graphs.
u To modify multiple graphs simultaneously
Example: To graph the functions y = ax
2
– b and y = ax + b, and then find out how a change
in variable a from 1 to 4 and a change in variable b from –2 to 2 affect the shape
and position of each graph
(1) On the application menu, tap
T
.
(2) Tap O and then J to display the Main application window.
Tip
• For details about using the Main application, see Chapter 2.
(3) Use the Main application work area to assign values to variables “a” and “b” (a = 1 and
b = 2 in this example).
9VbW aw
cW bw
(4) Tap O and then [Close] to close the Main application window.
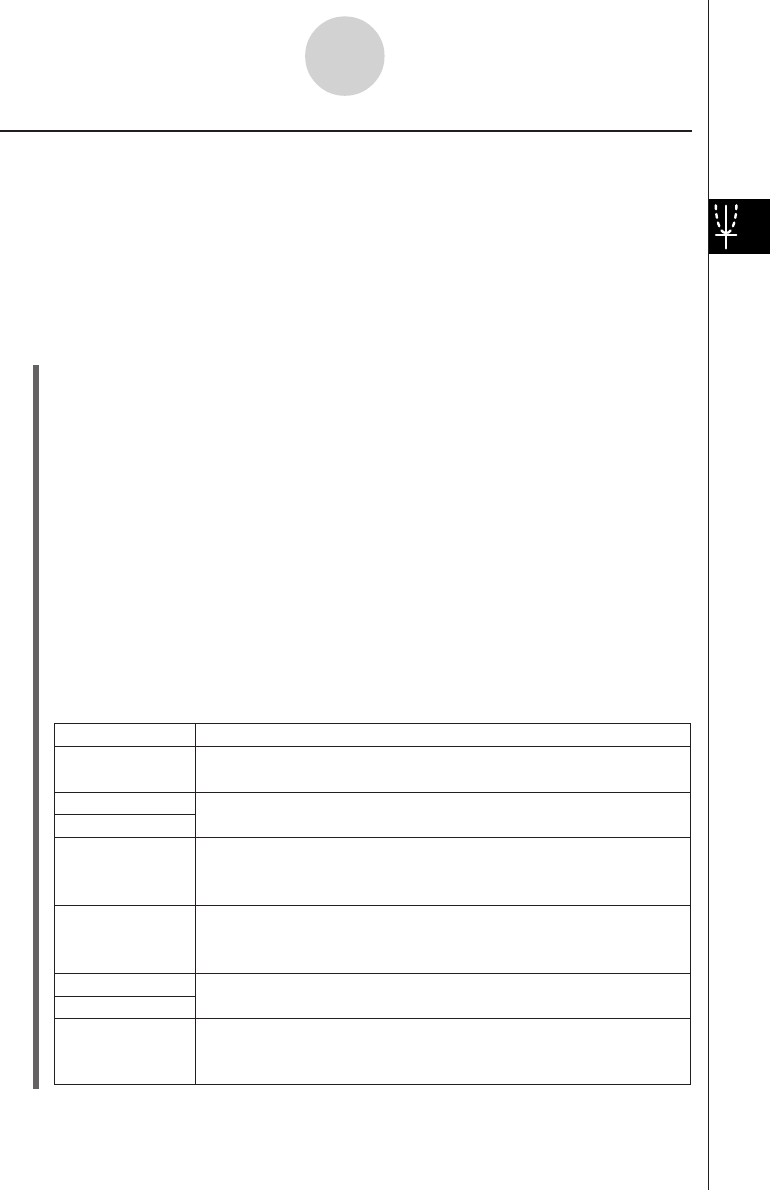
(5) Configure View Window parameters.
(6) On the Graph Editor window, input ax
2
– b in line y1, and ax + b in line y2.
(7) Tap $ to draw the graph.
(8) Tap a and then [Graph Controller]. This displays the Graph Controller dialog box.
(9) Configure the following settings on the Graph Controller dialog box.
3-5-4
Modifying a Graph
Description
Setting
Dynamic ]':
a
Start: 1
End: 4
Step: 1
Dynamic `$:
b
Start: –2
End: 2
Step: 1
Specifies a variable whose value is changed when you press the left
or right cursor key, or tap the left or right graph controller arrow.
These items specify the upper limit (End) and lower limit (Start) of
the range of change of the Dynamic ]' value.
Use this setting to specify the increment of change in the Dynamic
]' value when you press the left or right cursor key, or tap the left
or right graph controller arrow.
Specifies another variable whose value is changed when you press
the up or down cursor key, or tap the up or down graph controller
arrow.
These items specify the upper limit (End) and lower limit (Start) of
the range of change of the Dynamic `$ value.
Use this setting to specify the increment of change in the Dynamic
`$ value when you press the up or down cursor key, or tap the up
or down graph controller arrow.