
User Manual

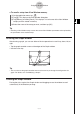
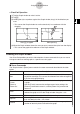
Table Of Contents
- Getting Ready
- Contents
- About This User’s Guide
- Chapter 1 Getting Acquainted
- Chapter 2 Using the Main Application
- 2-1 Main Application Overview
- 2-2 Basic Calculations
- 2-3 Using the Calculation History
- 2-4 Function Calculations
- 2-5 List Calculations
- 2-6 Matrix and Vector Calculations
- 2-7 Using the Action Menu
- 2-8 Using the Interactive Menu
- 2-9 Using the Main Application in Combination with Other Applications
- 2-10 Using Verify
- Chapter 3 Using the Graph & Table Application
- Chapter 4 Using the Conics Application
- Chapter 5 Using the 3D Graph Application
- Chapter 6 Using the Sequence Application
- Chapter 7 Using the Statistics Application
- 7-1 Statistics Application Overview
- 7-2 Using List Editor
- 7-3 Before Trying to Draw a Statistical Graph
- 7-4 Graphing Single-Variable Statistical Data
- 7-5 Graphing Paired-Variable Statistical Data
- 7-6 Using the Statistical Graph Window Toolbar
- 7-7 Performing Statistical Calculations
- 7-8 Test, Confidence Interval, and Distribution Calculations
- 7-9 Tests
- 7-10 Confidence Intervals
- 7-11 Distribution
- 7-12 Statistical System Variables
- Chapter 8 Using the Geometry Application
- Chapter 9 Using the Numeric Solver Application
- Chapter 10 Using the eActivity Application
- Chapter 11 Using the Presentation Application
- Chapter 12 Using the Program Application
- Chapter 13 Using the Spreadsheet Application
- Chapter 14 Using the Setup Menu
- Chapter 15 Configuring System Settings
- 15-1 System Setting Overview
- 15-2 Managing Memory Usage
- 15-3 Using the Reset Dialog Box
- 15-4 Initializing Your ClassPad
- 15-5 Adjusting Display Contrast
- 15-6 Configuring Power Properties
- 15-7 Specifying the Display Language
- 15-8 Specifying the Font Set
- 15-9 Specifying the Alphabetic Keyboard Arrangement
- 15-10 Optimizing “Flash ROM”
- 15-11 Specifying the Ending Screen Image
- 15-12 Adjusting Touch Panel Alignment
- 15-13 Viewing Version Information
- Chapter 16 Performing Data Communication
- Appendix

20050501
3-2-10
Using the Graph Window
Other Graph Window Operations
This section explains how to save a screenshot of the Graph Window, how to redraw a
graph, how to make the Graph Editor Window the active window.
k Saving a Screenshot of a Graph
Use the following procedures to save a screenshot of a graph as image data for later recall.
u To save a screenshot of a graph
(1) On the application menu, tap
T
.
(2) Draw the graph you want to save.
(3) Tap a and then [Store Picture]. This displays a dialog box for inputting a name for the
screenshot.
(4) Enter the name and then tap [OK].
u To recall a screenshot of a graph
(1) On the application menu, tap
T
.
(2) Tap the Graph window to make it active.
(3) Tap a and then [Recall Picture]. This displays a list of names of graph images you
have stored in memory.
(4) Select the name of the image you want, and then tap [OK].
k Redrawing a Graph
Use the following procedure to redraw a graph when necessary.
u ClassPad Operation
(1) Tap the Graph window to make it active.
(2) Tap a and then [ReDraw].
•While the Graph Editor window is active, you can redraw the graph by tapping $.
Important!
•Use the a - [ReDraw] command to redraw a graph that you drew by dragging an
expression from another window to the Graph window (see “2-9 Using the Main Application
in Combination with Other Applications”), or a graph you modified using some Sketch menu
(see “3-6 Using the Sketch Menu”). After deleting the redrawn graph, you can redraw the
graph of the expression selected on the Graph Editor window by tapping [Analysis],
[Sketch], and then [Cls].
k Making the Graph Editor Window the Active Window
While the Graph window is active, you can make the Graph Editor window the active window
by tapping anywhere inside of it or by tapping !.