
User Manual
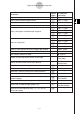
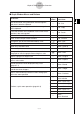
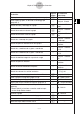
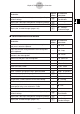
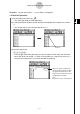
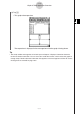
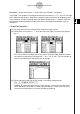

Table Of Contents
- Getting Ready
- Contents
- About This User’s Guide
- Chapter 1 Getting Acquainted
- Chapter 2 Using the Main Application
- 2-1 Main Application Overview
- 2-2 Basic Calculations
- 2-3 Using the Calculation History
- 2-4 Function Calculations
- 2-5 List Calculations
- 2-6 Matrix and Vector Calculations
- 2-7 Using the Action Menu
- 2-8 Using the Interactive Menu
- 2-9 Using the Main Application in Combination with Other Applications
- 2-10 Using Verify
- Chapter 3 Using the Graph & Table Application
- Chapter 4 Using the Conics Application
- Chapter 5 Using the 3D Graph Application
- Chapter 6 Using the Sequence Application
- Chapter 7 Using the Statistics Application
- 7-1 Statistics Application Overview
- 7-2 Using List Editor
- 7-3 Before Trying to Draw a Statistical Graph
- 7-4 Graphing Single-Variable Statistical Data
- 7-5 Graphing Paired-Variable Statistical Data
- 7-6 Using the Statistical Graph Window Toolbar
- 7-7 Performing Statistical Calculations
- 7-8 Test, Confidence Interval, and Distribution Calculations
- 7-9 Tests
- 7-10 Confidence Intervals
- 7-11 Distribution
- 7-12 Statistical System Variables
- Chapter 8 Using the Geometry Application
- Chapter 9 Using the Numeric Solver Application
- Chapter 10 Using the eActivity Application
- Chapter 11 Using the Presentation Application
- Chapter 12 Using the Program Application
- Chapter 13 Using the Spreadsheet Application
- Chapter 14 Using the Setup Menu
- Chapter 15 Configuring System Settings
- 15-1 System Setting Overview
- 15-2 Managing Memory Usage
- 15-3 Using the Reset Dialog Box
- 15-4 Initializing Your ClassPad
- 15-5 Adjusting Display Contrast
- 15-6 Configuring Power Properties
- 15-7 Specifying the Display Language
- 15-8 Specifying the Font Set
- 15-9 Specifying the Alphabetic Keyboard Arrangement
- 15-10 Optimizing “Flash ROM”
- 15-11 Specifying the Ending Screen Image
- 15-12 Adjusting Touch Panel Alignment
- 15-13 Viewing Version Information
- Chapter 16 Performing Data Communication
- Appendix
20050501
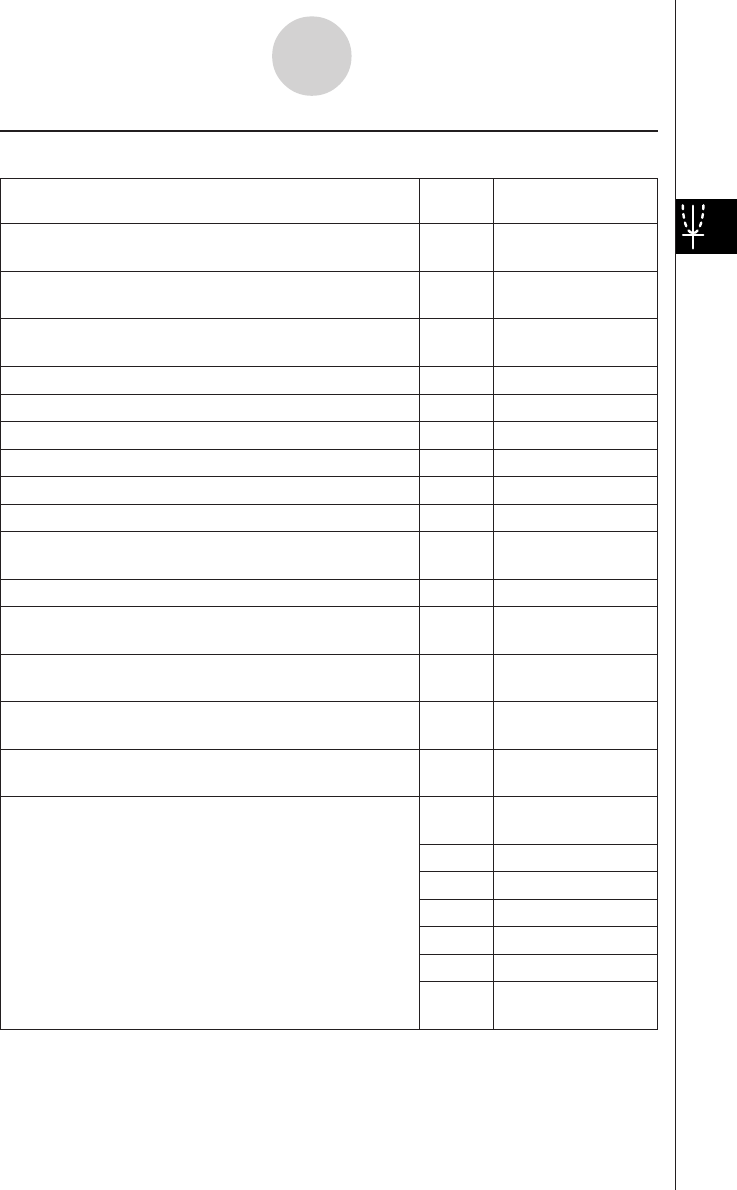
k Graph Window Menus and Buttons
To do this:
Tap this Or select this
button: menu item:
Cut the character string selected in the message box
—Edit - Cut
and place it onto the clipboard
Copy the character string selected in the message box
—Edit - Copy
to the clipboard
Paste the contents of the clipboard at the current cursor
—Edit - Paste
position in the message box
Select all of the text in the message box — Edit - Select All
Clear all of the Graph window contents — Edit - Clear All
Enlarge the part of the screen bounded by a box Q Zoom - Box
Specify a zoom factor — Zoom - Factor
Zoom in by the zoom factor — Zoom - Zoom In
Zoom out by the zoom factor — Zoom - Zoom Out
Configure View Window y-axis parameters and redraw
R Zoom - Auto
the graph so it fills the graph screen along the y-axis
Return a graph to its original size — Zoom - Original
Adjust View Window x-axis values so they are identical
— Zoom - Square
to the y-axis values
Round coordinate values displayed using Trace
— Zoom - Round
(page 3-7-1)
Make the value of each dot equal 1, which makes all
— Zoom - Integer
coordinate values integers
Return View Window parameters to their settings prior
— Zoom - Previous
to the last zoom operation
—
Zoom -
Quick Initialize
— Zoom - Quick Trig
— Zoom - Quick log(x)
Perform a quick zoom operation (page 3-2-9) — Zoom - Quick e^x
— Zoom - Quick x^2
— Zoom - Quick –x^2
—
Zoom -
Quick Standard
3-1-4
Graph & Table Application Overview