
User Manual


Table Of Contents
- Getting Ready
- Contents
- About This User’s Guide
- Chapter 1 Getting Acquainted
- Chapter 2 Using the Main Application
- 2-1 Main Application Overview
- 2-2 Basic Calculations
- 2-3 Using the Calculation History
- 2-4 Function Calculations
- 2-5 List Calculations
- 2-6 Matrix and Vector Calculations
- 2-7 Using the Action Menu
- 2-8 Using the Interactive Menu
- 2-9 Using the Main Application in Combination with Other Applications
- 2-10 Using Verify
- Chapter 3 Using the Graph & Table Application
- Chapter 4 Using the Conics Application
- Chapter 5 Using the 3D Graph Application
- Chapter 6 Using the Sequence Application
- Chapter 7 Using the Statistics Application
- 7-1 Statistics Application Overview
- 7-2 Using List Editor
- 7-3 Before Trying to Draw a Statistical Graph
- 7-4 Graphing Single-Variable Statistical Data
- 7-5 Graphing Paired-Variable Statistical Data
- 7-6 Using the Statistical Graph Window Toolbar
- 7-7 Performing Statistical Calculations
- 7-8 Test, Confidence Interval, and Distribution Calculations
- 7-9 Tests
- 7-10 Confidence Intervals
- 7-11 Distribution
- 7-12 Statistical System Variables
- Chapter 8 Using the Geometry Application
- Chapter 9 Using the Numeric Solver Application
- Chapter 10 Using the eActivity Application
- Chapter 11 Using the Presentation Application
- Chapter 12 Using the Program Application
- Chapter 13 Using the Spreadsheet Application
- Chapter 14 Using the Setup Menu
- Chapter 15 Configuring System Settings
- 15-1 System Setting Overview
- 15-2 Managing Memory Usage
- 15-3 Using the Reset Dialog Box
- 15-4 Initializing Your ClassPad
- 15-5 Adjusting Display Contrast
- 15-6 Configuring Power Properties
- 15-7 Specifying the Display Language
- 15-8 Specifying the Font Set
- 15-9 Specifying the Alphabetic Keyboard Arrangement
- 15-10 Optimizing “Flash ROM”
- 15-11 Specifying the Ending Screen Image
- 15-12 Adjusting Touch Panel Alignment
- 15-13 Viewing Version Information
- Chapter 16 Performing Data Communication
- Appendix
20050501
Inserting a Geometry Link Row
A Geometry Link row dynamically links data in the Geometry window with the corresponding
data in an eActivity. You can display lines and figures drawn in Geometry as values and
mathematical expressions in a Geometry Link row.
Dragging a line or figure from the Geometry window to a Geometry Link row in an eActivity
converts the line or figure to its mathematical expression. This expression is interlinked with
its Geometry window figure, so modifying one causes a corresponding change in the other.
u To input a Geometry Link row
Example: To drag one side of a triangle drawn on the Geometry window and link it to an
eActivity
(1) Open the eActivity application. Next, tap [Insert] and then [Geometry] to insert a
Geometry strip.
(2) On the Geometry window that appears in the lower half of the screen, draw a triangle.
• For details about Geometry window operations, see Chapter 8.
(3) Tap the eActivity window just below the Geometry strip.
• This makes eActivity the active window.
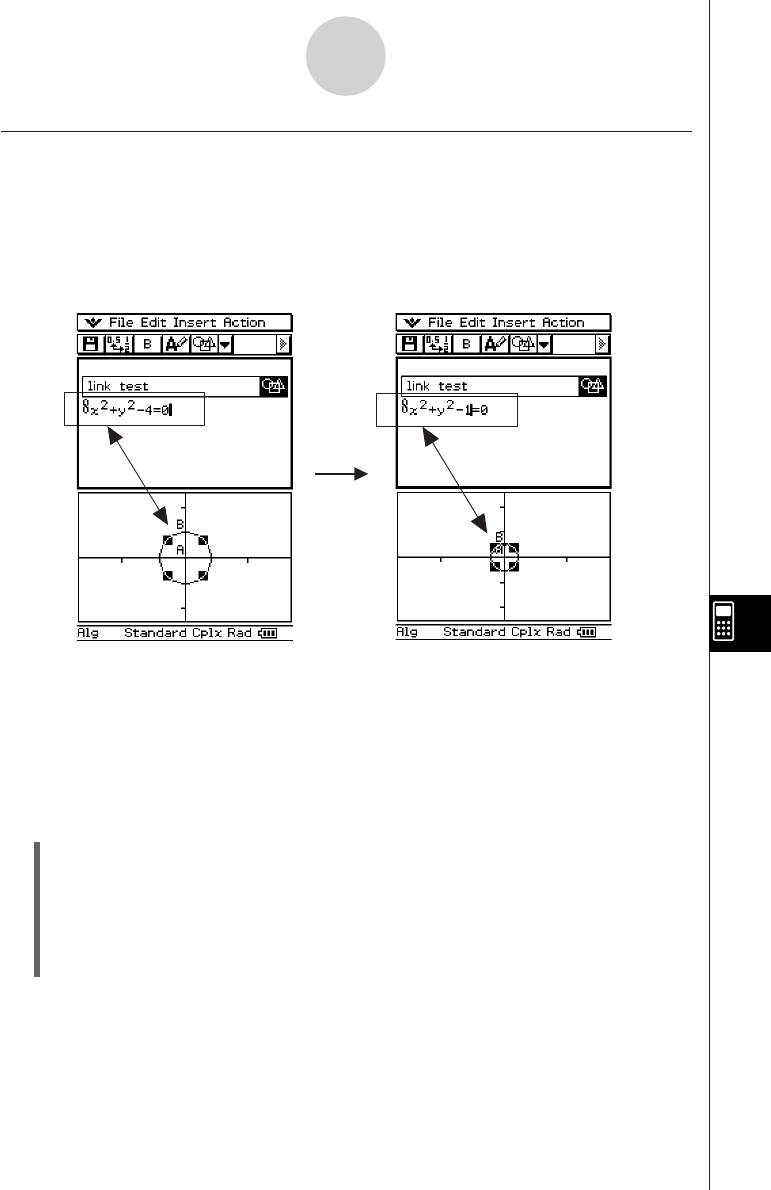
Example of inserting a Geometry Link row
Modifying the equation in a Geometry Link updates the figure in the Geometry window.
Conversely, changing the shape, position, or some other parameter of the figure on the
Geometry window updates the equation in the Geometry Link.
10-3-12
Inserting Data into an eActivity