
User Manual


Table Of Contents
- Getting Ready
- Contents
- About This User’s Guide
- Chapter 1 Getting Acquainted
- Chapter 2 Using the Main Application
- 2-1 Main Application Overview
- 2-2 Basic Calculations
- 2-3 Using the Calculation History
- 2-4 Function Calculations
- 2-5 List Calculations
- 2-6 Matrix and Vector Calculations
- 2-7 Using the Action Menu
- 2-8 Using the Interactive Menu
- 2-9 Using the Main Application in Combination with Other Applications
- 2-10 Using Verify
- Chapter 3 Using the Graph & Table Application
- Chapter 4 Using the Conics Application
- Chapter 5 Using the 3D Graph Application
- Chapter 6 Using the Sequence Application
- Chapter 7 Using the Statistics Application
- 7-1 Statistics Application Overview
- 7-2 Using List Editor
- 7-3 Before Trying to Draw a Statistical Graph
- 7-4 Graphing Single-Variable Statistical Data
- 7-5 Graphing Paired-Variable Statistical Data
- 7-6 Using the Statistical Graph Window Toolbar
- 7-7 Performing Statistical Calculations
- 7-8 Test, Confidence Interval, and Distribution Calculations
- 7-9 Tests
- 7-10 Confidence Intervals
- 7-11 Distribution
- 7-12 Statistical System Variables
- Chapter 8 Using the Geometry Application
- Chapter 9 Using the Numeric Solver Application
- Chapter 10 Using the eActivity Application
- Chapter 11 Using the Presentation Application
- Chapter 12 Using the Program Application
- Chapter 13 Using the Spreadsheet Application
- Chapter 14 Using the Setup Menu
- Chapter 15 Configuring System Settings
- 15-1 System Setting Overview
- 15-2 Managing Memory Usage
- 15-3 Using the Reset Dialog Box
- 15-4 Initializing Your ClassPad
- 15-5 Adjusting Display Contrast
- 15-6 Configuring Power Properties
- 15-7 Specifying the Display Language
- 15-8 Specifying the Font Set
- 15-9 Specifying the Alphabetic Keyboard Arrangement
- 15-10 Optimizing “Flash ROM”
- 15-11 Specifying the Ending Screen Image
- 15-12 Adjusting Touch Panel Alignment
- 15-13 Viewing Version Information
- Chapter 16 Performing Data Communication
- Appendix
20050501
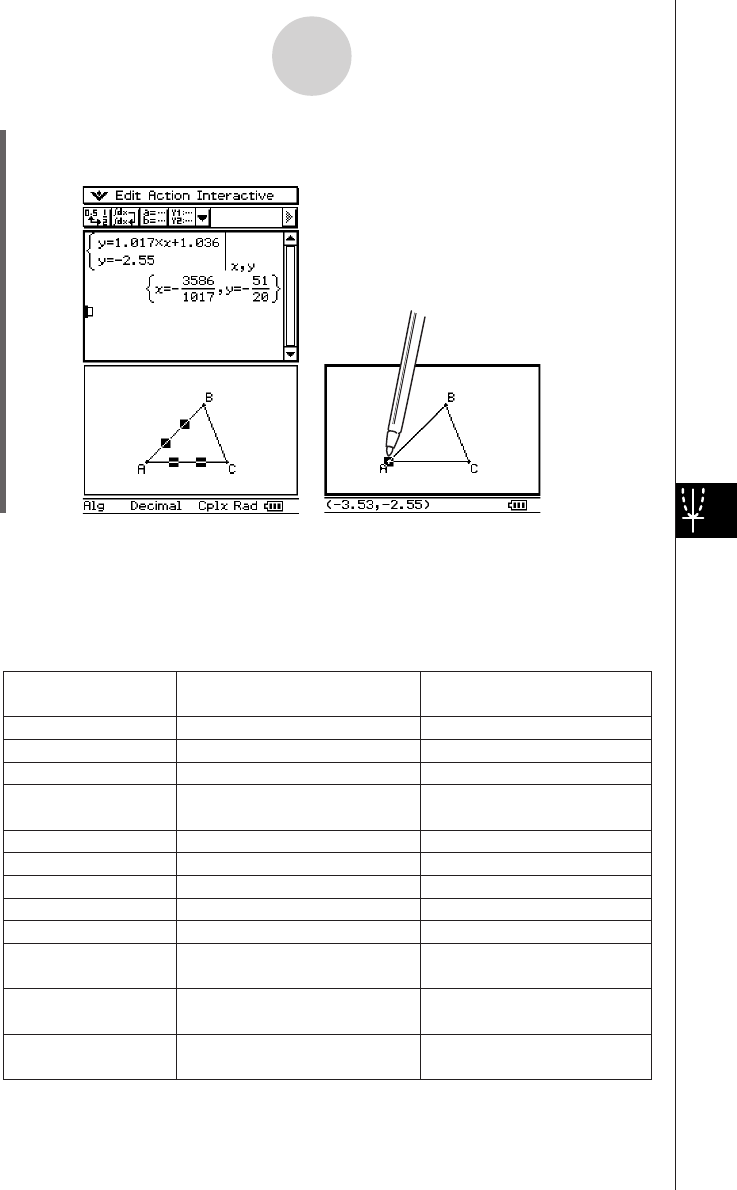
(5) Press E.
•Notice that the solution is the same as the coordinates of point A.
Tip
•Try using this drag and drop method to find the point of intersection of two lines. This is a great
way to find the solution to a system of equations.
•To view a fractional result as a decimal, tap the input row and then u.
• The information that appears when you drop a figure into another application depends on the
figure you are dragging. Many of the possible outcomes are listed in the table below.
Support for drag and drop into a
Geometry Link row* in an eActivity
Geometric Figure
Point
Line Segment
Infinite Line
Vector (Ray)
Circle
Arc
Ellipse
Function (
y=f
(x))
Two Lines
Polygon
Pairs of points related
by a transformation
Drag and drop into another
application transforms to:
An Ordered Pair
Linear Equation
Linear Equation
An Ordered Pair (head of vector,
assuming the tail is at the origin)
Equation of a Circle
Equation of a Circle
Equation of an Ellipse
Equation of the Function
System of Equations
Matrix Containing each Vertex
Point
Expression Showing Point
Relationship
yes
yes
yes
yes
yes
yes
yes
no
no
no
Open Polygon created
by Animation
Matrix Containing each Vertex
Point
no
no
* For details about a Geometry Link row, see “Inserting a Geometry Link Row” on page 10-3-12.
8-6-4
Using the Geometry Application with Other Applications
•To show the coordinates of A, just select
point A. Its coordinates will be displayed in
the status bar.