
User Manual


Table Of Contents
- Getting Ready
- Contents
- About This User’s Guide
- Chapter 1 Getting Acquainted
- Chapter 2 Using the Main Application
- 2-1 Main Application Overview
- 2-2 Basic Calculations
- 2-3 Using the Calculation History
- 2-4 Function Calculations
- 2-5 List Calculations
- 2-6 Matrix and Vector Calculations
- 2-7 Using the Action Menu
- 2-8 Using the Interactive Menu
- 2-9 Using the Main Application in Combination with Other Applications
- 2-10 Using Verify
- Chapter 3 Using the Graph & Table Application
- Chapter 4 Using the Conics Application
- Chapter 5 Using the 3D Graph Application
- Chapter 6 Using the Sequence Application
- Chapter 7 Using the Statistics Application
- 7-1 Statistics Application Overview
- 7-2 Using List Editor
- 7-3 Before Trying to Draw a Statistical Graph
- 7-4 Graphing Single-Variable Statistical Data
- 7-5 Graphing Paired-Variable Statistical Data
- 7-6 Using the Statistical Graph Window Toolbar
- 7-7 Performing Statistical Calculations
- 7-8 Test, Confidence Interval, and Distribution Calculations
- 7-9 Tests
- 7-10 Confidence Intervals
- 7-11 Distribution
- 7-12 Statistical System Variables
- Chapter 8 Using the Geometry Application
- Chapter 9 Using the Numeric Solver Application
- Chapter 10 Using the eActivity Application
- Chapter 11 Using the Presentation Application
- Chapter 12 Using the Program Application
- Chapter 13 Using the Spreadsheet Application
- Chapter 14 Using the Setup Menu
- Chapter 15 Configuring System Settings
- 15-1 System Setting Overview
- 15-2 Managing Memory Usage
- 15-3 Using the Reset Dialog Box
- 15-4 Initializing Your ClassPad
- 15-5 Adjusting Display Contrast
- 15-6 Configuring Power Properties
- 15-7 Specifying the Display Language
- 15-8 Specifying the Font Set
- 15-9 Specifying the Alphabetic Keyboard Arrangement
- 15-10 Optimizing “Flash ROM”
- 15-11 Specifying the Ending Screen Image
- 15-12 Adjusting Touch Panel Alignment
- 15-13 Viewing Version Information
- Chapter 16 Performing Data Communication
- Appendix
20050501
5-5-1
Other 3D Graph Application Functions
5-5 Other 3D Graph Application Functions
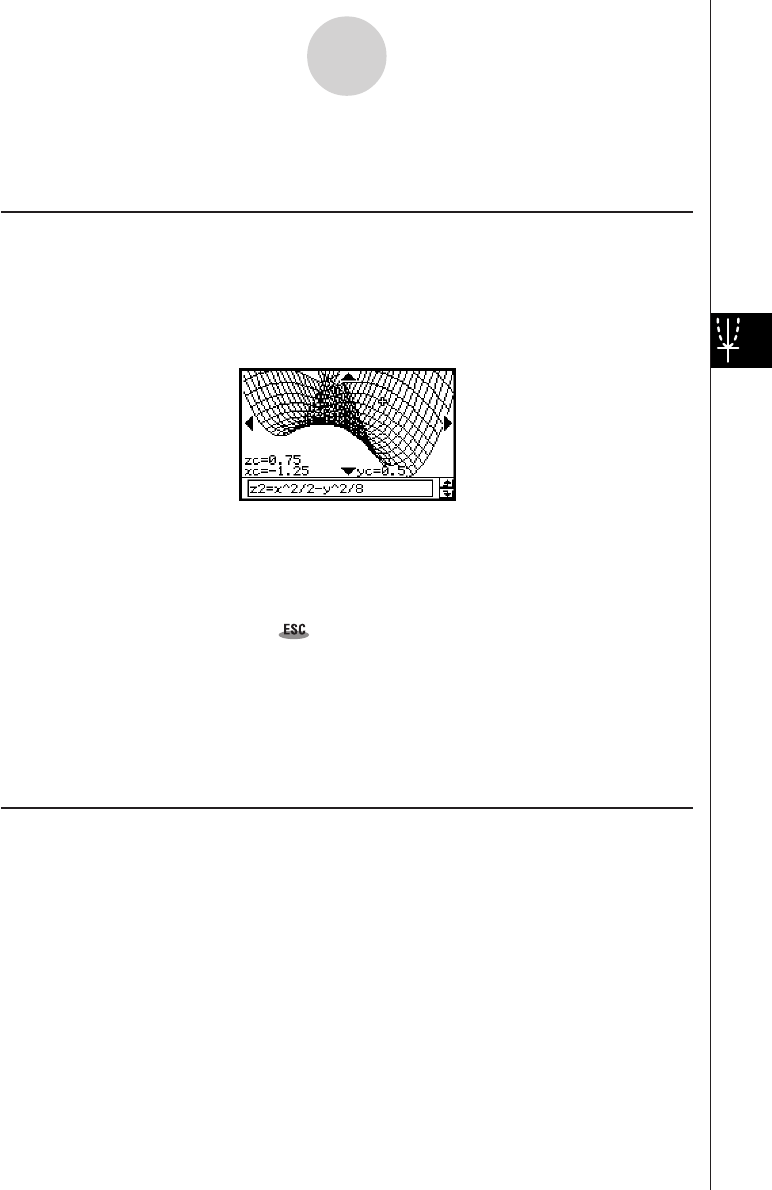
Using Trace to Read Graph Coordinates
Starting the trace operation causes a crosshair pointer to appear on the graph. You can then
press a cursor key or tap the graph controller arrows to move the pointer to the location you
want, and read the coordinates that appear on the display. To start the trace operation and
display the pointer, make the 3D Graph window active, and then tap =, or tap [Analysis]
and then [Trace].
• Each time you press the cursor key or tap a graph controller arrow, the pointer moves the
distance specified by the [grid] value on the 3D View Window dialog box.
• Inputting a value while a trace operation is being performed displays a dialog box for
inputting an x- and y-coordinate. Inputting values for each of the coordinates on this dialog
box causes the pointer to jump to the corresponding location when you tap [OK].
To cancel the trace operation, tap on the icon panel.
Tip
• The initial default setting for the coordinate display is rectangular coordinates (Rectangular).
Tapping O, [Settings], [Setup], and then [3D Format] displays the 3D Format dialog box, which
you can use to select polar coordinates (Polar) or to hide coordinate values entirely.
• For details about the settings you can configure on the 3D Format dialog box, see “3D Format
Dialog Box” on page 14-3-6.
Inserting Text into a 3D Graph Window
You can insert text into a 3D Graph window and delete it as required.
For more information, see “To write text on the Graph window” on page 3-6-2, and “To clear
figures inserted using the Sketch menu” on page 3-6-5.