
User Manual


Table Of Contents
- Getting Ready
- Contents
- About This User’s Guide
- Chapter 1 Getting Acquainted
- Chapter 2 Using the Main Application
- 2-1 Main Application Overview
- 2-2 Basic Calculations
- 2-3 Using the Calculation History
- 2-4 Function Calculations
- 2-5 List Calculations
- 2-6 Matrix and Vector Calculations
- 2-7 Using the Action Menu
- 2-8 Using the Interactive Menu
- 2-9 Using the Main Application in Combination with Other Applications
- 2-10 Using Verify
- Chapter 3 Using the Graph & Table Application
- Chapter 4 Using the Conics Application
- Chapter 5 Using the 3D Graph Application
- Chapter 6 Using the Sequence Application
- Chapter 7 Using the Statistics Application
- 7-1 Statistics Application Overview
- 7-2 Using List Editor
- 7-3 Before Trying to Draw a Statistical Graph
- 7-4 Graphing Single-Variable Statistical Data
- 7-5 Graphing Paired-Variable Statistical Data
- 7-6 Using the Statistical Graph Window Toolbar
- 7-7 Performing Statistical Calculations
- 7-8 Test, Confidence Interval, and Distribution Calculations
- 7-9 Tests
- 7-10 Confidence Intervals
- 7-11 Distribution
- 7-12 Statistical System Variables
- Chapter 8 Using the Geometry Application
- Chapter 9 Using the Numeric Solver Application
- Chapter 10 Using the eActivity Application
- Chapter 11 Using the Presentation Application
- Chapter 12 Using the Program Application
- Chapter 13 Using the Spreadsheet Application
- Chapter 14 Using the Setup Menu
- Chapter 15 Configuring System Settings
- 15-1 System Setting Overview
- 15-2 Managing Memory Usage
- 15-3 Using the Reset Dialog Box
- 15-4 Initializing Your ClassPad
- 15-5 Adjusting Display Contrast
- 15-6 Configuring Power Properties
- 15-7 Specifying the Display Language
- 15-8 Specifying the Font Set
- 15-9 Specifying the Alphabetic Keyboard Arrangement
- 15-10 Optimizing “Flash ROM”
- 15-11 Specifying the Ending Screen Image
- 15-12 Adjusting Touch Panel Alignment
- 15-13 Viewing Version Information
- Chapter 16 Performing Data Communication
- Appendix
20050501
3-3 Storing Functions
Use the Graph Editor window to store a Graph & Table application function. This section
covers Graph Editor operations, and explains how to store functions.
Using Graph Editor Sheets
The Graph Editor window has five tabbed sheets named Sheet 1 through Sheet 5, each of
which can contain up to 20 functions. You can have up to 100 functions stored in the Graph
Editor at one time.
You can graph up to 20 functions simultaneously, as long as all of the functions are on the
same sheet.
k Selecting a Sheet
Use the operations described below to change from one sheet to another.
3-3-1
Storing Functions
k Renaming a Sheet
Initially, the fives sheets are assigned default names from Sheet 1 through Sheet 5. You can
use these sheet names as they are, or you can perform the steps below to rename a sheet.
u ClassPad Operation
(1) Tap the tab of the sheet you want to rename so that sheet becomes active.
(2) Tap the tab of the active sheet again.
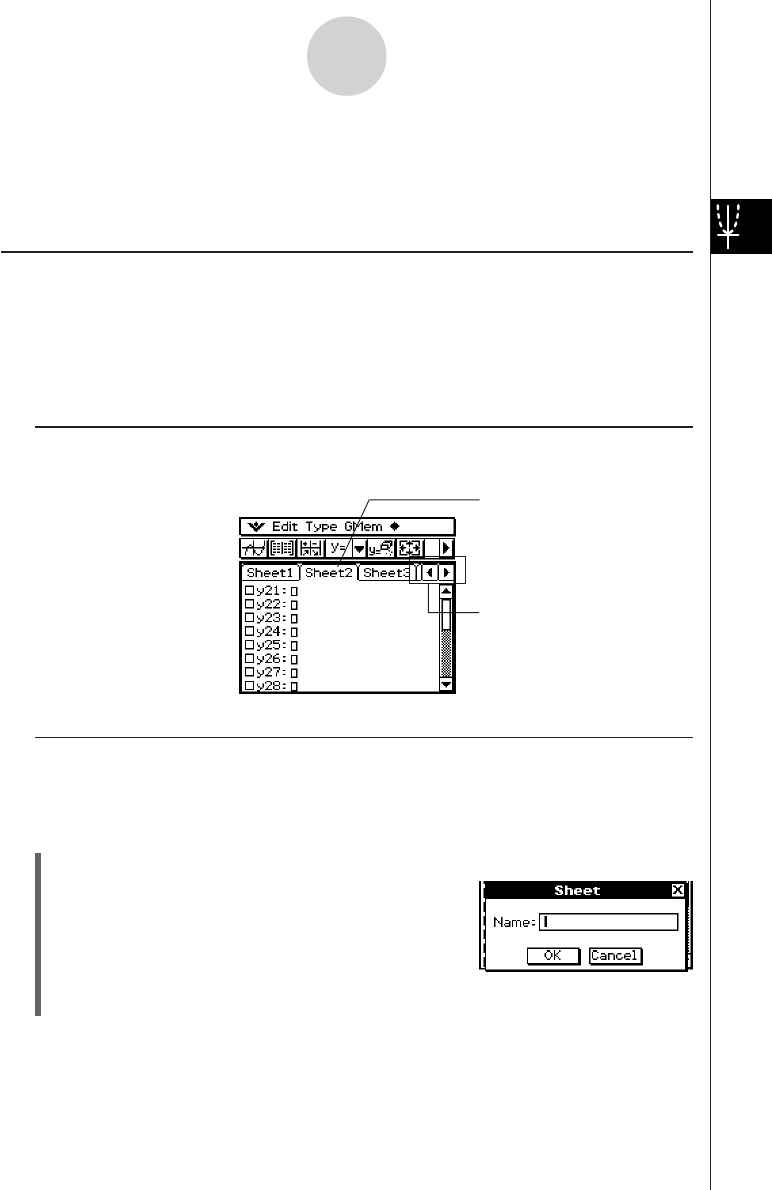
• This displays a dialog box for inputting a sheet
name.
(3) Enter up to 8 bytes for the sheet name, and then tap [OK].
Tap the tab of the sheet you
want to select. The currently
selected sheet is the “active”
sheet.
Tap here to scroll the tabs so
the ones that do not fit on the
current window come into view.