
User Manual


Table Of Contents
- Getting Ready
- Contents
- About This User’s Guide
- Chapter 1 Getting Acquainted
- Chapter 2 Using the Main Application
- 2-1 Main Application Overview
- 2-2 Basic Calculations
- 2-3 Using the Calculation History
- 2-4 Function Calculations
- 2-5 List Calculations
- 2-6 Matrix and Vector Calculations
- 2-7 Using the Action Menu
- 2-8 Using the Interactive Menu
- 2-9 Using the Main Application in Combination with Other Applications
- 2-10 Using Verify
- Chapter 3 Using the Graph & Table Application
- Chapter 4 Using the Conics Application
- Chapter 5 Using the 3D Graph Application
- Chapter 6 Using the Sequence Application
- Chapter 7 Using the Statistics Application
- 7-1 Statistics Application Overview
- 7-2 Using List Editor
- 7-3 Before Trying to Draw a Statistical Graph
- 7-4 Graphing Single-Variable Statistical Data
- 7-5 Graphing Paired-Variable Statistical Data
- 7-6 Using the Statistical Graph Window Toolbar
- 7-7 Performing Statistical Calculations
- 7-8 Test, Confidence Interval, and Distribution Calculations
- 7-9 Tests
- 7-10 Confidence Intervals
- 7-11 Distribution
- 7-12 Statistical System Variables
- Chapter 8 Using the Geometry Application
- Chapter 9 Using the Numeric Solver Application
- Chapter 10 Using the eActivity Application
- Chapter 11 Using the Presentation Application
- Chapter 12 Using the Program Application
- Chapter 13 Using the Spreadsheet Application
- Chapter 14 Using the Setup Menu
- Chapter 15 Configuring System Settings
- 15-1 System Setting Overview
- 15-2 Managing Memory Usage
- 15-3 Using the Reset Dialog Box
- 15-4 Initializing Your ClassPad
- 15-5 Adjusting Display Contrast
- 15-6 Configuring Power Properties
- 15-7 Specifying the Display Language
- 15-8 Specifying the Font Set
- 15-9 Specifying the Alphabetic Keyboard Arrangement
- 15-10 Optimizing “Flash ROM”
- 15-11 Specifying the Ending Screen Image
- 15-12 Adjusting Touch Panel Alignment
- 15-13 Viewing Version Information
- Chapter 16 Performing Data Communication
- Appendix
20050501
3-2-6
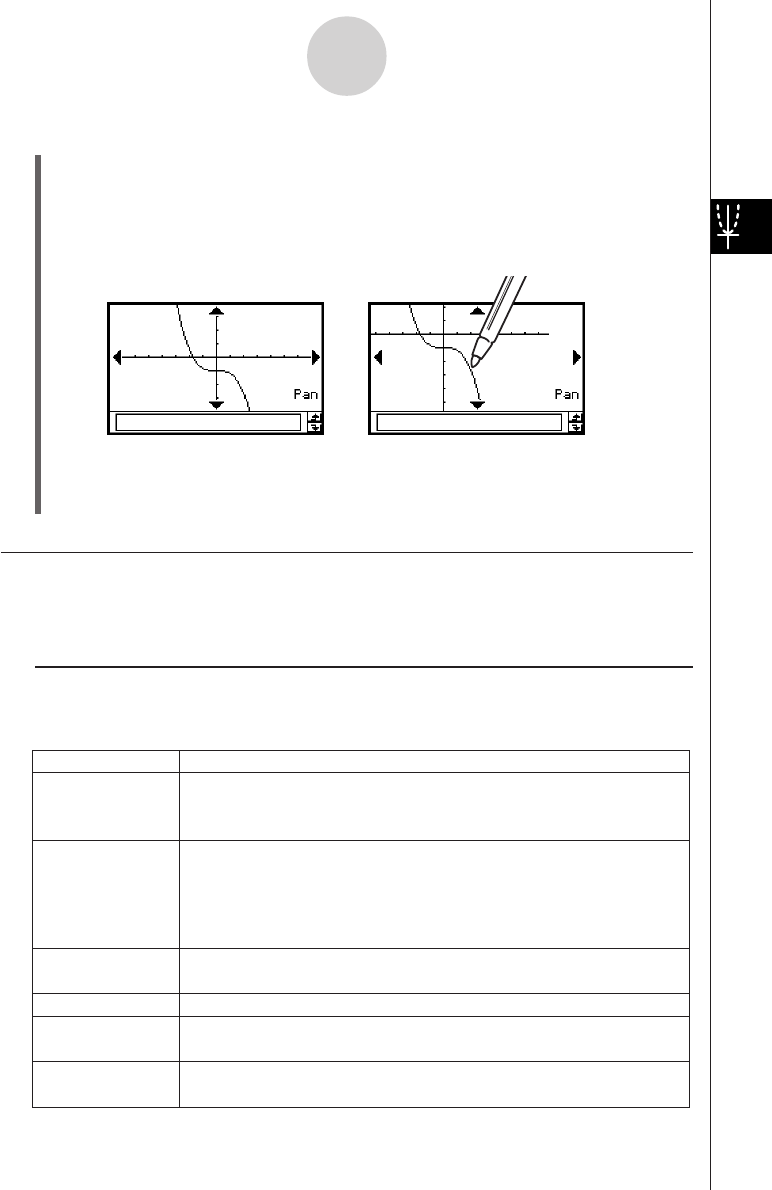
Using the Graph Window
u ClassPad Operation
(1) Tap the Graph window to make it active.
(2) Tap T.
(3) Holding the stylus anywhere against the Graph window, drag it in the direction you
want.
• This causes the Graph window to scroll automatically in accordance with the
dragging.
(4) When the Graph window shows the area you want, remove the stylus from the display.
• This causes the graph to be redrawn on the Graph window.
Zooming the Graph Window
Your ClassPad provides you with a wide selection of zoom commands that you can use to
enlarge or reduce an entire graph or a specific area of a graph.
k Zoom Commands
The Graph window’s [Zoom] menu contains the zoom commands described in the table
below.
Zoom Command
Description
Box
Factor
Zoom In
Zoom Out
Auto
Original
Square
Round
With “box zoom”, you draw a selection boundary around the area you
would like to enlarge. This causes the selected area to be enlarged so
it fills the entire graph display.
“Factor zoom” lets you specify a zoom factor for enlarging or reducing
a graph.
Use the [Factor] command to configure zoom factor settings, the
[Zoom In] command to zoom in, and the [Zoom Out] command to
zoom out.
“Auto zoom” automatically configures View Window
y-axis values and
redraws the graph so it fills the Graph window along the
y-axis.
Return a graph to its original View Window settings
Executing this command adjusts View Window
x-axis values so that
they are identical to the
y-axis values.
Round View Window settings (xmin, xmax, xdot) to an appropriate
number of decimal places and redraw the graph.
This command makes the value of each dot equal 1 which makes all
After T is tapped While panning