
User Manual
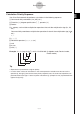


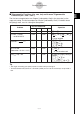
Table Of Contents
- Getting Ready
- Contents
- About This User’s Guide
- Chapter 1 Getting Acquainted
- Chapter 2 Using the Main Application
- 2-1 Main Application Overview
- 2-2 Basic Calculations
- 2-3 Using the Calculation History
- 2-4 Function Calculations
- 2-5 List Calculations
- 2-6 Matrix and Vector Calculations
- 2-7 Using the Action Menu
- 2-8 Using the Interactive Menu
- 2-9 Using the Main Application in Combination with Other Applications
- 2-10 Using Verify
- Chapter 3 Using the Graph & Table Application
- Chapter 4 Using the Conics Application
- Chapter 5 Using the 3D Graph Application
- Chapter 6 Using the Sequence Application
- Chapter 7 Using the Statistics Application
- 7-1 Statistics Application Overview
- 7-2 Using List Editor
- 7-3 Before Trying to Draw a Statistical Graph
- 7-4 Graphing Single-Variable Statistical Data
- 7-5 Graphing Paired-Variable Statistical Data
- 7-6 Using the Statistical Graph Window Toolbar
- 7-7 Performing Statistical Calculations
- 7-8 Test, Confidence Interval, and Distribution Calculations
- 7-9 Tests
- 7-10 Confidence Intervals
- 7-11 Distribution
- 7-12 Statistical System Variables
- Chapter 8 Using the Geometry Application
- Chapter 9 Using the Numeric Solver Application
- Chapter 10 Using the eActivity Application
- Chapter 11 Using the Presentation Application
- Chapter 12 Using the Program Application
- Chapter 13 Using the Spreadsheet Application
- Chapter 14 Using the Setup Menu
- Chapter 15 Configuring System Settings
- 15-1 System Setting Overview
- 15-2 Managing Memory Usage
- 15-3 Using the Reset Dialog Box
- 15-4 Initializing Your ClassPad
- 15-5 Adjusting Display Contrast
- 15-6 Configuring Power Properties
- 15-7 Specifying the Display Language
- 15-8 Specifying the Font Set
- 15-9 Specifying the Alphabetic Keyboard Arrangement
- 15-10 Optimizing “Flash ROM”
- 15-11 Specifying the Ending Screen Image
- 15-12 Adjusting Touch Panel Alignment
- 15-13 Viewing Version Information
- Chapter 16 Performing Data Communication
- Appendix
20050501
u Using the u Button to Toggle between the Standard Mode and Decimal
Mode
You can tap u to toggle a displayed value between Standard mode and Decimal mode
format.
Note that tapping u toggles the format of a displayed value. It does not change the current
Standard mode/Decimal mode setting.
Example 1: Tapping u while the ClassPad is configured for Standard mode (Normal 1)
display
Expression ClassPad Operation Displayed Result
baa/gu
100 ÷ 6 = 16.6666666...
(Switches to Decimal mode format.)
16.66666667
u (Switches back to Standard mode
50
format.) 3
Example 2: Tapping u while the ClassPad is configured for Decimal mode (Normal 1)
display
Expression ClassPad Operation Displayed Result
9c)+cu
2 + 2 = 3.414213562...
(Switches to Standard mode format.)
2 + 2
u
(Switches back to Decimal mode format.)
3.414213562
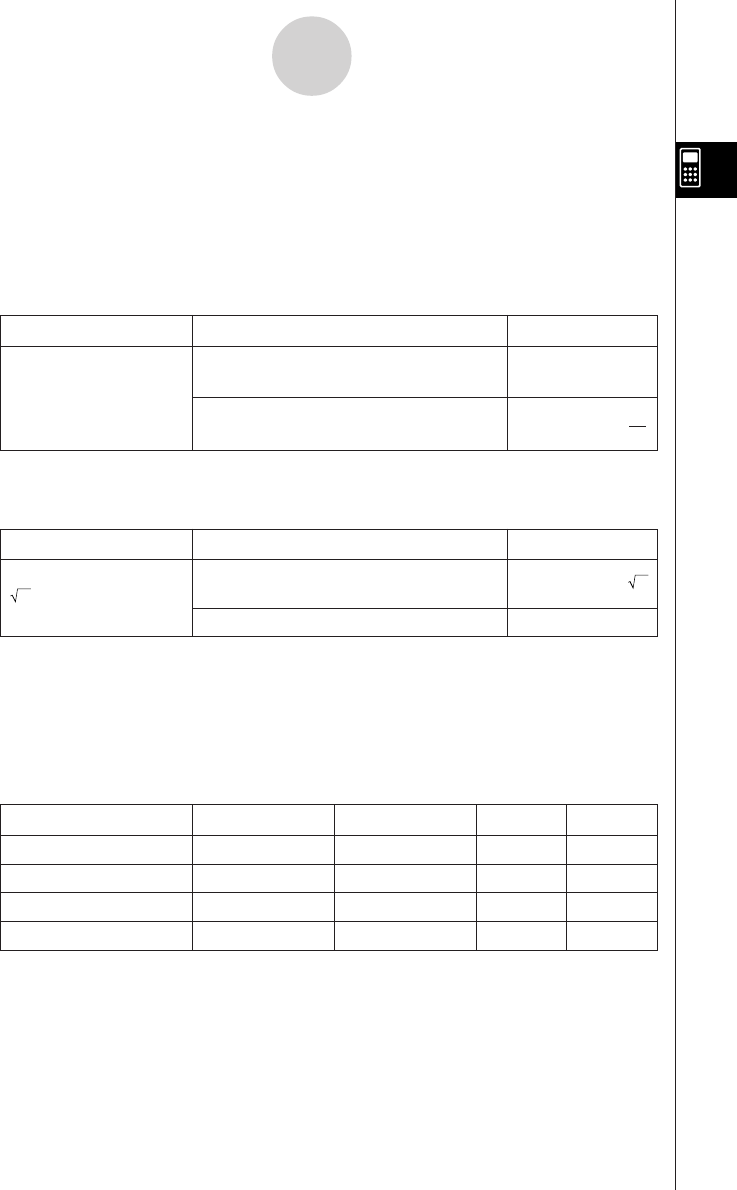
u Number of Decimal Places, Number of Significant Digits, Normal Display
Settings
The [Display] settings on the Basic Format dialog box (page 14-3-1) specify the number of
decimal places, the number of significant digits, and the normal display setting for Main
application Decimal mode calculation results. The following shows how calculation results
appear under each setting.
Expression Normal 1 Normal 2 Fix 3 Sci 3
50 ÷ 4 = 12.5 12.5 12.5 12.500 1.25E + 1
100 ÷ 6 = 16.6666666... 16.66666667 16.66666667 16.667 1.67E + 1
1 ÷ 600 = 0.00166666... 1.666666667E –3 0.00166666666 0.002 1.67E – 3
10
11
÷ 4 = 2.5E + 10 2.5E + 10 2.5E + 10 2.5E + 10 2.50E + 10
• The allowable range for the number of decimal places is Fix 0 to Fix 9, and the range for
the number of significant digits is Sci 0 to Sci 9. For details about the [Display] settings, see
“Basic Format Dialog Box” on page 14-3-1.
2-2-6
Basic Calculations