Chapter Program Library 1 2 3 4 5 Prime Factor Analysis Greatest Common Measure t-Test Value Circle and Tangents Rotating a Figure Before using the Program Library • Be sure to check how many bytes of unused memory is remaining before attempting to perform any programming. • This Program Library is divided into two sections: a numeric calculation section and a graphics section.
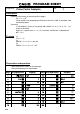
PROGRAM SHEET Program for No. Prime Factor Analysis 1 Description Produces prime factors of arbitrary positive integers For 1 < m < 1010 Prime numbers are produced from the lowest value first. “END” is displayed at the end of the program. (Overview) m is divided by 2 and by all successive odd numbers (d = 3, 5, 7, 9, 11, 13, ....) to check for divisibility. Where d is a prime factor, mi = mi–1/d is assumed, and division is repeated until mi + 1 < d.
No.
PROGRAM SHEET Program for No. Greatest Common Measure 2 Description Euclidean general division is used to determine the greatest common measure for two interers a and b. For |a|, |b| < 109, positive values are taken as < 1010 (Overview) n0 = max (|a|, |b|) n1 = min (|a|, |b|) nk–2 nk–1 nk = nk–2 – ––– nk–1 k = 2, 3.... If nk = 0, then the greatest common measure (c) will be nk–1.
No.
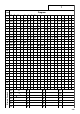
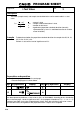
PROGRAM SHEET Program for No. t-Test Value 3 Description The mean (sample mean) and sample standard deviation can be used to obtain a t-test value.
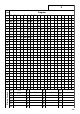
No. Line File name 1 2 3 4 5 6 Memory Contents 7 3 Program T { 5 l-Var Lbl ( " Goto 5 4 List 0 x T 0 T 5 , 1 : – = E , 5 , " M " A B C D E F G S T 5 4 , 5 2 } → List 1 _ M " ? → ) ÷ ( xσn–1 : T ^ H I J K L M N 1 , 5 1 _ M _ ÷ n 5 , ) → O P Q R S T U m 5 3 , 5 3 , T _ V W X Y Z t • t-distribution table The values in the top row of the table show the probability (two-sided probability) that the absolute value of t is greater than the table values for a given degree of freedom.
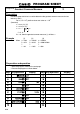
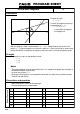
PROGRAM SHEET Program for No. Circle and Tangents 4 Description Formula for circle: x2 + y2 = r2 Y A (x',y') Formula for tangent line passing through point A (x', y'): y – y' = m (x – x') r 0 X * m represents the slope of the tangent line With this program, slope m and intercept b (= y' – mx') are obtained for lines drawn from point A (x', y') and are tangent to a circle with a radius of r.
No.
No. Line 35 36 37 38 39 40 41 42 43 Program Prog " S = Graph Y= N Goto 3 Lbl 9 Graph Y= M Prog " : Goto Lbl 3 " E C 2 ( _ _ ( W 6 _ N I ⇒ X R Graph Y= – X – I N _ C M A L ( ) " I N (–) 6 1 , 1 D . O W 3 , 6 File name C 1 Graph Y= C R ( x2 E – R x File name W 1 View Window 2 2 420 Graph Y= I (–) R ( L E X + A ) + D O W D 44 4 2 " : S – A ) B ^ = + B ^ " : Prog " . 3 , X x2 – X ) _ ) x 2 1 , 1 ⇒ Goto 9 _ B _ C I R C L E " (–) 3 . 1 , 3 .
Program for Step Circle and Tangents Key Operation No.
Program for Step 6 7 8 9 10 422 Circle and Tangents Key Operation No.
Program for Step Circle and Tangents Key Operation No.
Program for Step 16 17 18 424 Circle and Tangents Key Operation No.
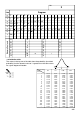
PROGRAM SHEET Program for No. Rotating a Figure 5 Description Formula for coordinate transformation: (x, y) → (x', y') Y x' = x cos θ – y sin θ y' = x sin θ + y cos θ C(x3, y3) B(x2, y2) A(x1, y1) 0 X Graphing of rotation of any geometric figure by θ degrees. Example To rotate by 45° the triangle defined by points A (2, 0.5), B (6, 0.5), and C (5, 1.5) Notes • Use the cursor keys to move the pointer around the display.
No. Line Program File name R 1 View Window 2 3 4 5 6 7 8 9 10 11 12 13 14 15 16 17 18 19 20 21 22 23 24 25 26 27 28 29 30 31 32 33 34 426 5 . " X " Plot X " X " Plot X " X " Plot X Lbl Line " A A Plot C C Plot E E Plot Plot Cls O (–) 4 ( 1 Y A → ( 2 Y C → ( 3 Y E → 1 : A cos sin G cos sin I cos sin K G : T 0 , X = 1 , A X = 2 , C X = 3 , E _ Plot N Q Q , Q Q , Q Q , , Plot A T E . 4 , 1 2 .
Program for Step Rotating a Figure Key Operation No.
Program for Step Rotating a Figure Key Operation 6 (Locate the pointer at X = 5) 7 8 9 10 Continue, repeating from step 8. 428 No.