
Calculator User's Guide
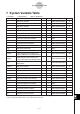
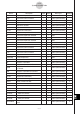
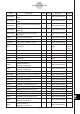
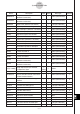
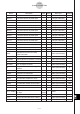
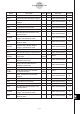
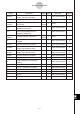
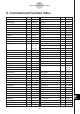
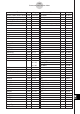
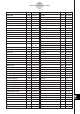
Table Of Contents
- Getting Ready
- Contents
- About This User’s Guide
- Chapter 1 Getting Acquainted
- Chapter 2 Using the Main Application
- 2-1 Main Application Overview
- 2-2 Basic Calculations
- 2-3 Using the Calculation History
- 2-4 Function Calculations
- 2-5 List Calculations
- 2-6 Matrix and Vector Calculations
- 2-7 Using the Action Menu
- 2-8 Using the Interactive Menu
- 2-9 Using the Main Application in Combination with Other Applications
- 2-10 Using Verify
- Chapter 3 Using the Graph & Table Application
- Chapter 4 Using the Conics Application
- Chapter 5 Using the 3D Graph Application
- Chapter 6 Using the Sequence Application
- Chapter 7 Using the Statistics Application
- 7-1 Statistics Application Overview
- 7-2 Using List Editor
- 7-3 Before Trying to Draw a Statistical Graph
- 7-4 Graphing Single-Variable Statistical Data
- 7-5 Graphing Paired-Variable Statistical Data
- 7-6 Using the Statistical Graph Window Toolbar
- 7-7 Performing Statistical Calculations
- 7-8 Test, Confidence Interval, and Distribution Calculations
- 7-9 Tests
- 7-10 Confidence Intervals
- 7-11 Distribution
- 7-12 Statistical System Variables
- Chapter 8 Using the Geometry Application
- Chapter 9 Using the Numeric Solver Application
- Chapter 10 Using the eActivity Application
- Chapter 11 Using the Presentation Application
- Chapter 12 Using the Program Application
- Chapter 13 Using the Spreadsheet Application
- Chapter 14 Using the Setup Menu
- Chapter 15 Configuring System Settings
- 15-1 System Setting Overview
- 15-2 Managing Memory Usage
- 15-3 Using the Reset Dialog Box
- 15-4 Initializing Your ClassPad
- 15-5 Adjusting Display Contrast
- 15-6 Configuring Power Properties
- 15-7 Specifying the Display Language
- 15-8 Specifying the Font Set
- 15-9 Specifying the Alphabetic Keyboard Arrangement
- 15-10 Optimizing “Flash ROM”
- 15-11 Specifying the Ending Screen Image
- 15-12 Adjusting Touch Panel Alignment
- 15-13 Viewing Version Information
- Chapter 16 Performing Data Communication
- Appendix

20050501
Name Description Input Delete Data Type Default
Sres22 Calculation Result for StatGraph2 – – LIST {Real Number}
Sres31 Calculation Result for StatGraph3 – – LIST {Real Number}
Sres32 Calculation Result for StatGraph3 – – LIST {Real Number}
Sres41 Calculation Result for StatGraph4 – – LIST {Real Number}
Sres42 Calculation Result for StatGraph4 – – LIST {Real Number}
Sres51 Calculation Result for StatGraph5 – – LIST {Real Number}
Sres52 Calculation Result for StatGraph5 – – LIST {Real Number}
Sres61 Calculation Result for StatGraph6 – – LIST {Real Number}
Sres62 Calculation Result for StatGraph6 – – LIST {Real Number}
Sres71 Calculation Result for StatGraph7 – – LIST {Real Number}
Sres72 Calculation Result for StatGraph7 – – LIST {Real Number}
Sres81 Calculation Result for StatGraph8 – – LIST {Real Number}
Sres82 Calculation Result for StatGraph8 – – LIST {Real Number}
Sres91 Calculation Result for StatGraph9 – – LIST {Real Number}
Sres92 Calculation Result for StatGraph9 – – LIST {Real Number}
sStat
Standard Error Value for LinReg
––EXPR (Real Number)
TTest Calculation
SumSA Sum of Squares for Factor A – – EXPR (Real Number)
SumSAB
Sum of Squares for Factor A
×
Factor B
––EXPR (Real Number)
SumSB Sum of Squares for Factor B – – EXPR (Real Number)
SumSErr Sum of Squares for Error – – EXPR (Real Number)
tc
Graph Coordinate Value Storage
––EXPR (Real Number) 0
Variable
tLower Result of TCD Calculation – – EXPR (Real Number)
tUpper Result of TCD Calculation – – EXPR (Real Number)
Tvalue t Value – – EXPR (Real Number)
tθmax View Window Tθ
Maximum Value 䊊 – EXPR (Real Number) 2π
tθmin View Window Tθ
Minimum Value 䊊 – EXPR (Real Number) 0
tθStep View Window Tθ
Step Value Variable 䊊 – EXPR (Real Number) π/60
o Mean of x (Statistics Calculation) – – EXPR (Real Number)
o1 Mean of Data 1 – – EXPR (Real Number)
x1(y)~x100(y)
Graph Expression Input Variable, 䊊
䊊 FUNC
X= Type (Define)
x1InvN Result of InvNorm Calculation – – EXPR (Real Number)
x1σn–1 Sample Standard Deviation of Data 1 – – EXPR (Real Number)
o2 Mean of Data 2 – – EXPR (Real Number)
α
-7-5
System Variable Table