
Calculator User's Guide
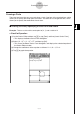
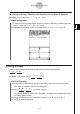
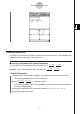
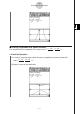
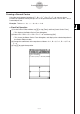
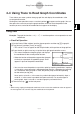
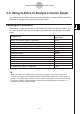
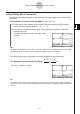
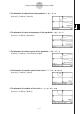

Table Of Contents
- Getting Ready
- Contents
- About This User’s Guide
- Chapter 1 Getting Acquainted
- Chapter 2 Using the Main Application
- 2-1 Main Application Overview
- 2-2 Basic Calculations
- 2-3 Using the Calculation History
- 2-4 Function Calculations
- 2-5 List Calculations
- 2-6 Matrix and Vector Calculations
- 2-7 Using the Action Menu
- 2-8 Using the Interactive Menu
- 2-9 Using the Main Application in Combination with Other Applications
- 2-10 Using Verify
- Chapter 3 Using the Graph & Table Application
- Chapter 4 Using the Conics Application
- Chapter 5 Using the 3D Graph Application
- Chapter 6 Using the Sequence Application
- Chapter 7 Using the Statistics Application
- 7-1 Statistics Application Overview
- 7-2 Using List Editor
- 7-3 Before Trying to Draw a Statistical Graph
- 7-4 Graphing Single-Variable Statistical Data
- 7-5 Graphing Paired-Variable Statistical Data
- 7-6 Using the Statistical Graph Window Toolbar
- 7-7 Performing Statistical Calculations
- 7-8 Test, Confidence Interval, and Distribution Calculations
- 7-9 Tests
- 7-10 Confidence Intervals
- 7-11 Distribution
- 7-12 Statistical System Variables
- Chapter 8 Using the Geometry Application
- Chapter 9 Using the Numeric Solver Application
- Chapter 10 Using the eActivity Application
- Chapter 11 Using the Presentation Application
- Chapter 12 Using the Program Application
- Chapter 13 Using the Spreadsheet Application
- Chapter 14 Using the Setup Menu
- Chapter 15 Configuring System Settings
- 15-1 System Setting Overview
- 15-2 Managing Memory Usage
- 15-3 Using the Reset Dialog Box
- 15-4 Initializing Your ClassPad
- 15-5 Adjusting Display Contrast
- 15-6 Configuring Power Properties
- 15-7 Specifying the Display Language
- 15-8 Specifying the Font Set
- 15-9 Specifying the Alphabetic Keyboard Arrangement
- 15-10 Optimizing “Flash ROM”
- 15-11 Specifying the Ending Screen Image
- 15-12 Adjusting Touch Panel Alignment
- 15-13 Viewing Version Information
- Chapter 16 Performing Data Communication
- Appendix
20050501
4-5-1
Using G-Solve to Analyze a Conics Graph
4-5 Using G-Solve to Analyze a Conics Graph
The G-Solve menu includes commands that let you perform a variety of different analytical
processes on a graph drawn on the Conics Graph window.
Displaying the G-Solve Menu
While there is a graph on the Conics Graph window, tap [Analysis] and then [G-Solve]. You
can then use the [G-Solve] menu that appears to perform one of the operations described
below.
Tip
• Some commands are available only for certain types of graphs. Any command that is not
available for the graph currently displayed on the Conics Graph window has a line through it. A
parabola, for example, does not have a center, radius or asymptotes, so there are lines through
the [Center], [Radius], and [Asymptotes] commands of the [G-Solve] menu when there is a
parabola on the Conics Graph window.
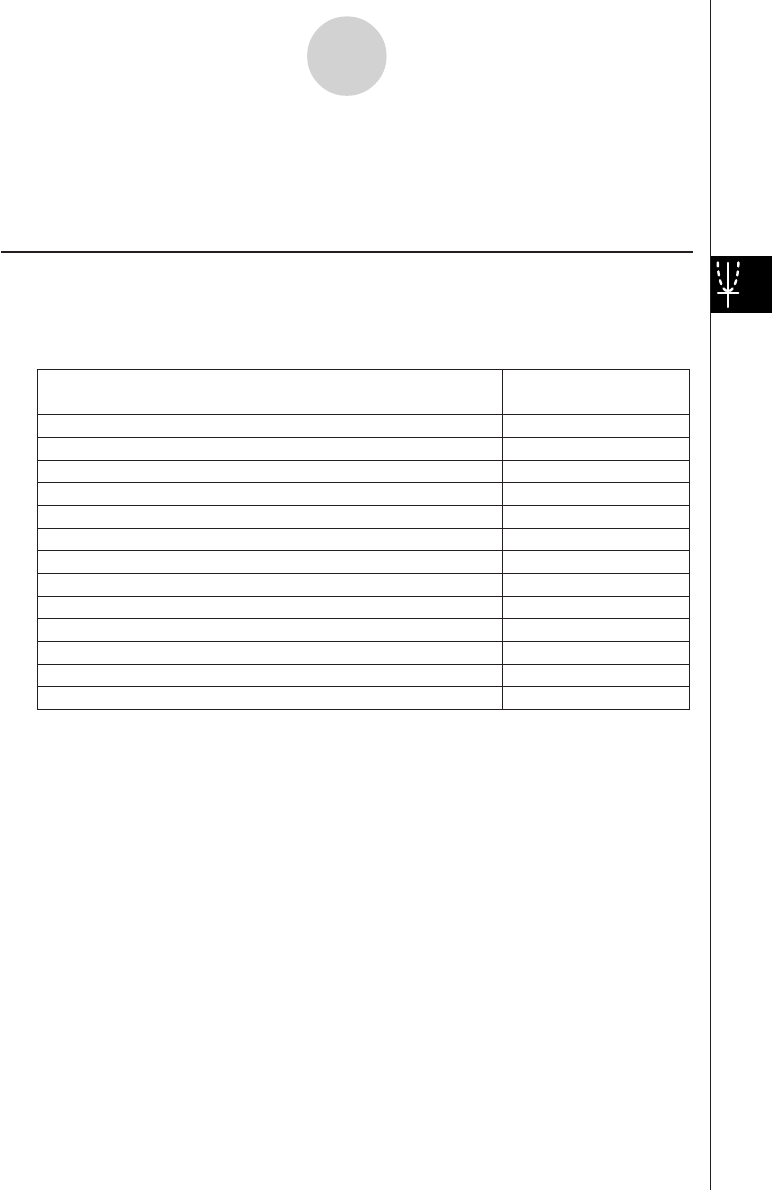
Focus of a parabola, ellipse, or hyperbola
Vertex of a parabola, ellipse, or hyperbola
Directrix of a parabola
Axis of symmetry of a parabola
Length of the latus rectum of a parabola
Center point of a circle, ellipse, or hyperbola
Radius of a circle
x-intercept
y-intercept
x-coordinate for a given y-coordinate
Asymptotes of a hyperbola
Eccentricity of a parabola, ellipse, or hyperbola
Focus
Vertex
Directrix
Symmetry
Latus Rectum Length
Center
Radius
Asymptotes
Eccentricity
x
-
Intercept
y
-
Intercept
x-Cal
y-coordinate for a given x-coordinate
y-Cal
Select this [G-Solve]
menu item:
To obtain this: