
Calculator User's Guide
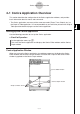
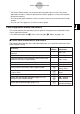
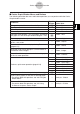

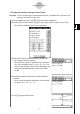
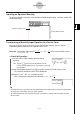
Table Of Contents
- Getting Ready
- Contents
- About This User’s Guide
- Chapter 1 Getting Acquainted
- Chapter 2 Using the Main Application
- 2-1 Main Application Overview
- 2-2 Basic Calculations
- 2-3 Using the Calculation History
- 2-4 Function Calculations
- 2-5 List Calculations
- 2-6 Matrix and Vector Calculations
- 2-7 Using the Action Menu
- 2-8 Using the Interactive Menu
- 2-9 Using the Main Application in Combination with Other Applications
- 2-10 Using Verify
- Chapter 3 Using the Graph & Table Application
- Chapter 4 Using the Conics Application
- Chapter 5 Using the 3D Graph Application
- Chapter 6 Using the Sequence Application
- Chapter 7 Using the Statistics Application
- 7-1 Statistics Application Overview
- 7-2 Using List Editor
- 7-3 Before Trying to Draw a Statistical Graph
- 7-4 Graphing Single-Variable Statistical Data
- 7-5 Graphing Paired-Variable Statistical Data
- 7-6 Using the Statistical Graph Window Toolbar
- 7-7 Performing Statistical Calculations
- 7-8 Test, Confidence Interval, and Distribution Calculations
- 7-9 Tests
- 7-10 Confidence Intervals
- 7-11 Distribution
- 7-12 Statistical System Variables
- Chapter 8 Using the Geometry Application
- Chapter 9 Using the Numeric Solver Application
- Chapter 10 Using the eActivity Application
- Chapter 11 Using the Presentation Application
- Chapter 12 Using the Program Application
- Chapter 13 Using the Spreadsheet Application
- Chapter 14 Using the Setup Menu
- Chapter 15 Configuring System Settings
- 15-1 System Setting Overview
- 15-2 Managing Memory Usage
- 15-3 Using the Reset Dialog Box
- 15-4 Initializing Your ClassPad
- 15-5 Adjusting Display Contrast
- 15-6 Configuring Power Properties
- 15-7 Specifying the Display Language
- 15-8 Specifying the Font Set
- 15-9 Specifying the Alphabetic Keyboard Arrangement
- 15-10 Optimizing “Flash ROM”
- 15-11 Specifying the Ending Screen Image
- 15-12 Adjusting Touch Panel Alignment
- 15-13 Viewing Version Information
- Chapter 16 Performing Data Communication
- Appendix
20050501
4-1-2
Conics Application Overview
Conics Application Menus and Buttons
This section explains the operations you can perform using the menus and buttons of the
Conics application window.
• For information about the O menu, see “Using the O Menu” on page 1-5-4.
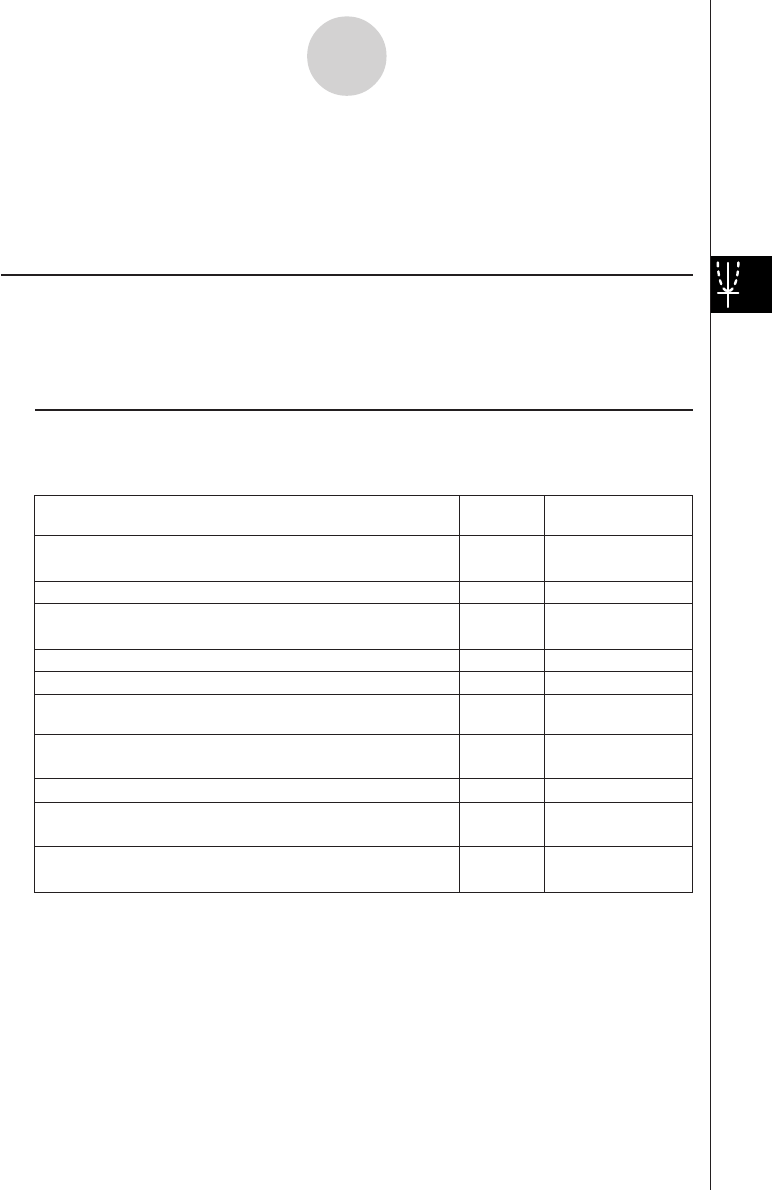
k Conics Editor Window Menus and Buttons
The following describes the menu and button operations you can perform while the Conics
Editor window is active.
To do this:
Tap this
button:
Or select this
menu item:
Copy the selected character string to the clipboard
Select all of the text on the Conics Editor window
Clear all of the text from the Conics Editor window
Insert a Conics Form on the Conics Editor window
—
—
—
—
—
w
q
Edit - Cut
Edit - Copy
Edit - Paste
Edit - Select All
Edit - Clear All
Fit - Fit into Conics
Form
O - Settings -
View Window
O - Settings -
Variable Manager
Form - Insert
Conics Form
Cut the selected character string and place it onto the
clipboard
Adjust the equation on the Conics Editor window so it fits
a Conics Form
^ —
Draw a graph
6
Display the View Window dialog box (page 3-2-1) to
configure Graph window settings
5
Display the Variable Manager (page 1-8-1)
Paste the contents of the clipboard at the current cursor
position in the Conics Editor window
• The Conics Editor window can have one conics equation input at a time. The Conics
application includes a number of preset conics formats (page 4-2-1) that make equation
input quick and easy.
•You can tap the graph controller arrows or use the cursor key to scroll the Conics Graph
window.
•You can use Trace (page 4-4-1) to trace a conics graph.