
Calculator User's Guide
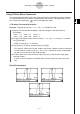
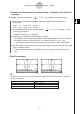
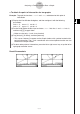
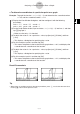
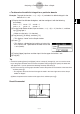


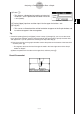
Table Of Contents
- Getting Ready
- Contents
- About This User’s Guide
- Chapter 1 Getting Acquainted
- Chapter 2 Using the Main Application
- 2-1 Main Application Overview
- 2-2 Basic Calculations
- 2-3 Using the Calculation History
- 2-4 Function Calculations
- 2-5 List Calculations
- 2-6 Matrix and Vector Calculations
- 2-7 Using the Action Menu
- 2-8 Using the Interactive Menu
- 2-9 Using the Main Application in Combination with Other Applications
- 2-10 Using Verify
- Chapter 3 Using the Graph & Table Application
- Chapter 4 Using the Conics Application
- Chapter 5 Using the 3D Graph Application
- Chapter 6 Using the Sequence Application
- Chapter 7 Using the Statistics Application
- 7-1 Statistics Application Overview
- 7-2 Using List Editor
- 7-3 Before Trying to Draw a Statistical Graph
- 7-4 Graphing Single-Variable Statistical Data
- 7-5 Graphing Paired-Variable Statistical Data
- 7-6 Using the Statistical Graph Window Toolbar
- 7-7 Performing Statistical Calculations
- 7-8 Test, Confidence Interval, and Distribution Calculations
- 7-9 Tests
- 7-10 Confidence Intervals
- 7-11 Distribution
- 7-12 Statistical System Variables
- Chapter 8 Using the Geometry Application
- Chapter 9 Using the Numeric Solver Application
- Chapter 10 Using the eActivity Application
- Chapter 11 Using the Presentation Application
- Chapter 12 Using the Program Application
- Chapter 13 Using the Spreadsheet Application
- Chapter 14 Using the Setup Menu
- Chapter 15 Configuring System Settings
- 15-1 System Setting Overview
- 15-2 Managing Memory Usage
- 15-3 Using the Reset Dialog Box
- 15-4 Initializing Your ClassPad
- 15-5 Adjusting Display Contrast
- 15-6 Configuring Power Properties
- 15-7 Specifying the Display Language
- 15-8 Specifying the Font Set
- 15-9 Specifying the Alphabetic Keyboard Arrangement
- 15-10 Optimizing “Flash ROM”
- 15-11 Specifying the Ending Screen Image
- 15-12 Adjusting Touch Panel Alignment
- 15-13 Viewing Version Information
- Chapter 16 Performing Data Communication
- Appendix
20050501
3-8 Analyzing a Function Used to Draw a Graph
Your ClassPad includes a G-Solve feature that lets you perform a variety of different
analytical processes on an existing graph.
G-Solve Menu Overview
To access the [G-Solve] menu, tap [Analysis] and then [G-Solve]. The following describes the
commands that are available on the [G-Solve] menu.
3-8-1
Analyzing a Function Used to Draw a Graph
Tip
• See page
α
-9-1 of the Appendix for information about graph types and executable G-Solve
functions.
Root (the x-intercept)
Maximum value
Minimum value
y-intercept
Point of intersection for two graphs
y-coordinate for a given x-coordinate
x-coordinate for a given y-coordinate
Definite integral for a particular range
Point of inflection
Distance between two points
Volume of a solid of revolution
Root
Max
Min
y-Intercept
Intersect
y-Cal
x-Cal
∫ dx
Inflection
Distance
π ∫ (
f(x))
2
dx
Select this G-Solve menu command:
To obtain this for the graph: